by Peter Pantscharowitsch1, Dr. Götz-Andreas Kemmner, Andreas Gillessen
Many manufacturers in labor-intensive industries have been relocating their production abroad for years. However, the Pirmasens-based shoe manufacturer Peter Kaiser decided to build a new factory in Germany. In addition to this new construction project to merge the German plants, all divisions underwent a streamlined restructuring. With this new organizational form, Peter Kaiser wants to keep the Pirmasens site internationally competitive for the future.
Peter Kaiser produces 1.4 million pairs of women’s shoes in the upper price segment every year at its two locations in Pirmasens and Legares, Portugal. At the start of the project, the Pirmasens site with one main plant and two external plants accounted for 1.2 million pairs of shoes. A further 200,000 pairs were produced in Legares. Thanks to a prudent and forward-looking business policy, Peter Kaiser was able to hold its own in the competitive shoe market and operate profitably despite the high proportion of personnel costs associated with the product. However, it was foreseeable that cost increases due to the high-quality materials, especially leather, and labor cost increases would eat up the earnings generated at the German location in just a few years. Against this background, Peter Kaiser commissioned Abels & Kemmner in August 2001 to draw up a medium-term location concept for the Pirmasens production site.
The aim of the “OptiKaiser” project was and is to keep shoe production at the Pirmasens site internationally competitive. To this end, options for further organizational, technical and capacity-related development had to be developed, evaluated and combined into an overall concept and compared with the alternative of expanding production in Portugal.
Bottleneck analysis
The most important fields of action for this resulted from the bottleneck analysis with which Abels & Kemmner began the project work at Peter Kaiser. This swift and detailed analysis revealed potential for improvement in the areas of location structure, procurement organization, shipping, information technology, store floor productivity (with the work areas of production technology, process stability, material flow & layout and work organization) and start-up management. These fields of action were structured into sub-projects and a project team was defined for each sub-project, which was responsible for the conceptual development in workshops under the various expansion scenarios. The sub-concepts were then evaluated from a business perspective in accordance with the selected expansion scenario in order to ultimately develop the overall concept in a way that would allow a decision to be made. Based on this, the financing concept and an implementation plan were developed.
Location planning
The results showed that the new construction project at the Pirmasens site was superior to relocating production to Portugal and making new investments there. The following factors ultimately led to the decision to invest in Pirmasens:
- Labor productivity at the Pirmasens site is still higher than at the plant in Legares.
- There was a sufficient number of highly qualified staff in Pirmasens who were familiar with the high quality requirements.
- The well-established, flexible supplier structure ensures a much better supply of materials at the Pirmasens site than at the Legares site.
- The bottleneck analysis and the subsequent sub-projects revealed considerable potential for improvement, which could be realized much more quickly in Pirmasens than in Portugal.
Due to these key factors, the investment in Pirmasens is already being amortized at a time when the corresponding production and personnel capacities are not yet available in Portugal. As a result, the new Pirmasens location concept won out over the alternative in Portugal thanks to better EBT and cash flow.
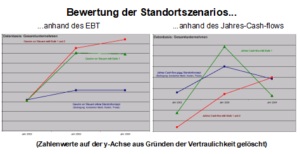
A three-stage action scenario with several alternative courses of action at each stage was developed for the site planning. At each stage, the most sensible option was selected on the basis of strategic criteria and detailed cash flow and earnings analyses. A number of fundamentally possible alternative courses of action were eliminated because the further development of the productivity measures in the individual sub-projects confirmed what had already become apparent in the bottleneck analysis:
- The integration of the two external plants (Plant III and Plant V) was unavoidable, although both plants achieved the highest productivity figures in an internal comparison due to their lean structures and limited product ranges. However, this productivity advantage was offset by considerable interface costs.
- Numerous productivity potentials at the Pirmasens site can only be exploited by means of an improved material flow and a more stringent production layout.
Development of future location structures
It was essential to compare the existing plants as part of an internal benchmarking process as a basis for deciding on the future location structures. The benchmarking should provide information on how the productivity situations in the four plants present themselves, taking into account the plant-specific boundary conditions and what the specific success factors are. The realization was that the two small external plants in Pirmasens were more productive, even taking into account the lean structures only possible through Plant 1 and the smaller production spectrum. This had a decisive influence on the design of the new material flow and production layout for the extension.
The way to the goal
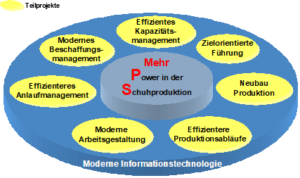
In order to develop a sufficient basis for management decisions based on earnings and cash flow analyses, some homework had to be done beforehand. In detail, the sub-projects that Abels & Kemmner supported for two months following the initial bottleneck analysis covered the following areas, the most important of which are explained in more detail below.
Peter Kaiser offers six collections to the market every year. Around 1,500 prototypes are produced in preparation for the collections. This results in around 600 models, which are offered in up to 15 shoe sizes. The variety of colors and materials on offer results in around 1,350 different material options. Shoe retailers can now choose individual color and material variants within the models of a collection, which ultimately results in around 12,000 article variants. All these items are made to order in up to 40 steps, in an average order batch size of 8 pairs per day – mass customization at its best!
To ramp up around 600 new models a year in several phases requires sophisticated workflows and a high level of coordination between the departments. In order to make the start-up of new models even smoother, a start-up management system was introduced. Among other things, representatives from collection development, production, purchasing and planning meet regularly in an SE team2 to exchange experiences with the production of new prototypes and to coordinate development and planning measures. Furthermore, a detailed “planning matrix” will soon provide a detailed overview of the degree of completion of each tool and the procurement status of each purchased part. A consistent reduction in the variety of parts combined with standardization measures will simplify the procurement and production processes without restricting the design freedom of the modellers or reducing the variety of models.
OptiKaiser project phases
The “OptiKaiser” project was divided into 4 phases: 1. bottleneck analysis and sub-project planning, 2. rough concept, 3. overall concept and 4. implementation. In the first phase, the key areas for action were identified along with their improvement approaches and the resulting productivity and rationalization potential. In the second phase, these areas of activity had to be structured into their individual sub-projects and their productivity potential examined and conceptualized under various expansion scenarios. The third phase then served to develop an overall concept from the various expansion scenarios, to evaluate it from a business management perspective and to develop a financing concept and an implementation plan, which was then presented to the Supervisory Board. 4th phase was to be carried out. In line with Abels & Kemmner’s repowering approach, parts of the productivity measures have already been implemented in parallel with the 2. and 3rd phase implemented.
Productivity controlling
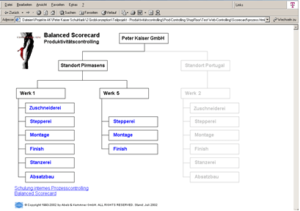
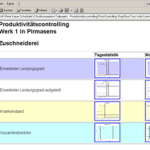
In order to be able to measure and compare all plants and their production departments on a daily basis in future, a long-term productivity controlling system was set up on the basis of the internal benchmarking metrics already developed. The aim is to enable plant and department managers and foremen to manage their areas in a target-oriented manner by providing daily feedback on the performance achieved and comparing it with the jointly developed target values.
Productivity controlling is structured as follows:
- All key figures are measured daily. In addition, the key figures are summarized into monthly values and tracked over the last 25 months. After a start-up phase, target values were set for each department
- At present, the key figures are measured per department. They will later be measured for each master area
- The key figures are discussed daily between the foreman and the head of department. As a result of the meetings, measures for improvement are defined and implemented. A “list of explanations and measures” is kept to track the implementation of the agreed measures.
- All key figures and the “List of explanations and measures” are displayed in the department. A continuous improvement process / change management is to be established on the basis of the key performance indicator system.
- The key figures are aggregated upwards over the following stages:
- Work process – foreman area – department – plant – location – entire company
- The key figures are kept on a central information system. Authorized users can access the key figures via the internal network or the Internet using an Internet browser
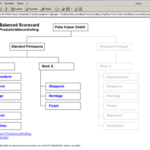
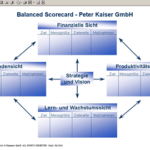
In a further step, productivity controlling was integrated into an overarching balanced scorecard, in which key figures beyond pure productivity controlling will also be managed and documented at a later date.
In addition to the measures outlined here, a whole series of other measures have been and are being implemented, all of which pursue the common goal of securing the long-term profitability of footwear production at the Pirmasens site in the face of international competition under the motto “More horsepower”. The activities described here show that the optimum location for existing location structures cannot be determined solely by the wage level. Instead, an analysis of all business options is required in order to make a well-founded final decision. This sometimes turns out differently than one’s entrepreneurial instinct would have previously advised. This at least confirms the basis for Peter Kaiser’s decision.
1Mr.Peter Pantscharowitsch is Technical Director of Peter Kaiser GmbH, Pirmasens
2Simultaneousengineering team

