Optimization project corrects IT weakness
Götz-Andreas Kemmner and Bernd Reineke
High delivery readiness often comes at the price of high inventories. That doesn’t have to be the case. At a technical retailer, stocks of pilot articles were reduced by 50%. Total inventory turnover was increased from 5.6 to 7.5 within a short period of time, which frees up liquidity. All of this without any loss in delivery readiness of 98.5% and without any additional costs for scheduling staff. This was made possible by using an optimization and scheduling tool for the merchandise management system.
In addition to a comprehensive product portfolio and excellent advice, technical trade depends on perfect logistics. This is characterized by very high delivery readiness and places the highest demands on employees, organization and systems. To optimize procurement processes, stock turnover rates of 9 per year should be aimed for. However, this value is often significantly lower. If, for example, a stock turnover of less than 6 is measured, this means that the material is lying dead in the warehouse for over two months, tying up capital. In order to be able to release this, extensive analyses are required to optimize the planning of thousands of articles.
In a specific project in technical trade, for example, most items were procured with high minimum order quantities. Some are also available in small sales-optimized packaging units. These variants are each supplied by a different supplier. Around 80% of a total of 8,000 items are in stock and are sold from the inventory. The other items are procured on an order-related basis and are generally delivered directly from the supplier to the customer.

Problem case IT
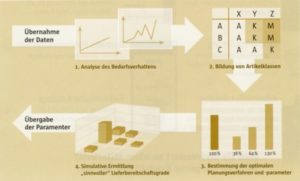
It quickly became clear that the goal of high inventory turnover rates was only possible with corresponding changes to the software-supported scheduling. Although the items in stock were planned and ordered once or twice a week by the buyers, the IT system only provided rudimentary support for the planners: at least MRP lists with all the relevant information were issued, but the buyers had to view them all and create the orders manually if necessary. For items that are easy to plan, the existing system has also been expanded to include an automatic function with reorder point procedures and target ranges of coverage, but these do not take into account the individual consumption behavior of the items and can therefore only be set as a general rule. In this respect, there was a clear need for action.
A series of analyses and simulations of the logistical behavior of the procurement and distribution chain were required in order to increase stock turnover while guaranteeing high delivery readiness (Fig. 2):
- ABC and XYZ analysis for structuring the range of articles
- Trend and seasonal analysis
- Definition of stockpiling strategies and target delivery readiness levels
- Simulation of various logistical scenarios with different logistical parameters
The analyses were accompanied by optimizing measures to reduce logistical parameters such as replenishment time, minimum purchase quantities and batch sizes, which Purchasing was able to renegotiate with the suppliers.
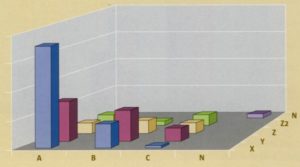
The evaluation of inventories as part of the ABC/XYZ analysis clearly shows that the purchasers understood very well how to hold inventories in the AB-XY range in order to achieve a high level of readiness to deliver for these items, while at the same time not taking a high risk due to regular consumption and avoiding inventories in the Z and Z2 ranges, which are difficult to plan (Fig. 3).
Further analysis showed that only an insignificant proportion of the articles (<1%) had a trend character, but 5% of the articles showed seasonal behavior (see example in Figure 1), which was known to the buyers but had not previously been considered for automated replenishment.
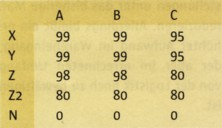
For the simulation and optimization runs, it is necessary to define the stocking strategies, which specify which items are to be stocked and which delivery readiness levels are targeted. Since the order-related items were already excluded from the analyses in advance, all remaining 80% of the items must be in stock. Using the ABC/XYZ matrix, the project team set the target delivery readiness levels with the aim of maintaining the very high required value of 98.5% (Table 1).
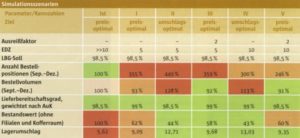
The ability to purchase from different suppliers with different options played a key role in defining the simulation scenarios. Of particular interest was the question of how the price advantage of the price-optimized scenarios with large batches would affect the shorter delivery times and lower minimum order quantities (turnover-optimized scenarios). In the simulation runs, this was taken into account by the different logistical parameters such as delivery time, goods receipt processing time and minimum order quantities as well as the different purchase prices. The simulation scenarios are shown in Tab. 2 shown.
Shorter cover periods, lower inventories, more order items
To assess the simulation results, the order volume and the number of order items over a comparative period were used in addition to the stock level and the degree of readiness to deliver. This is because the reduction in minimum order quantities and stocking periods inevitably results in more order items and therefore, of course, more goods receipt processes. The results are shown in the lower section of Tab. 1 at a glance.
When comparing the price-optimized and turnover-optimized scenarios, it quickly became clear that the 13 to 28% higher order volume compared to the actual situation exceeded the cost savings from the inventory reduction several times over and was therefore unacceptable. Similarly, the number of order items would more than triple in the scenarios with optimum turnover, thus significantly increasing the cost of purchasing and goods receipt. For this reason, only the price-optimal scenarios were considered below.
In summary, it can be observed that shorter cover periods lead to lower inventories, but drive up the number of order items. The outlier factor, which makes it possible to smooth out peaks in demand in the historical data, also has the effect of reducing inventories due to lower forecast values. Overall, the price-optimized scenario V was selected, in which the target inventory value is 40% below the actual inventory value and thus an inventory turnover of 9.35 per year is achieved. The target of 9 transshipments per year set by the company management would thus be achieved.
During the project work, it became apparent that the merchandise management system used in the company was not able to adequately support the redesigned supply chain in terms of sales forecasting and ordering. For this reason, it was decided to use the “Diskover” software add-on tool for these tasks. With the help of this automation option, the purchasing department is now able to process the number of order items, which has increased by almost 250% compared to before, with the same number of staff. Assuming that all easily predictable X and Y articles can be ordered automatically in future, i.e. without the intervention of the buyer, the overall effort involved in creating orders can be reduced to below the current level. However, there will still be increased costs for incoming goods, which can still be managed by the logistics department to the extent calculated.
Significant portfolio reduction in a short time
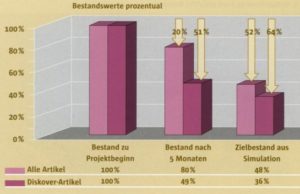
The project results had a positive impact after just a short time. The results for the pilot articles purchased with the MRP tool are more significant than for the conventionally procured articles, which also fell due to the reduction in minimum order quantities and delivery times: over 50% reduction in stock after five months (Fig. 4).

