How are your sales shares doing?
by Dr. Götz-Andreas Kemmner
Can the market mechanisms of the stock exchange be transferred to the forecasting of market requirements? Can this be used to further optimize sales forecasts and ultimately produce more in sync with the market?
Demand forecasts are also an important topic in the age of pull systems. Traditionally, demand forecasts are obtained from two sources: On the one hand, historical data is used to determine predictions for future demand. On the other hand, attempts are made to forecast on the basis of the sales department’s market assessments. For many reasons, however, sales estimates usually lead to worse results than forecasts based on historical data. However, their forecasting quality also depends heavily on how well the prediction mechanisms are optimized. Suitable historical data is not always available; at the latest then the question of alternatives to forecasting demand arises.
In recent years, forecast stock markets have come to the attention of the public. The Iowa Electronic Markets of the University of Iowa (www.biz.uiowa.edu/iem), which has been operating virtual stock markets for research and training purposes since the late 1980s, is probably the starting point for prediction stock markets. The experiment started with predictions for political elections, but now there is also an exchange for predicting the profits of the American computer industry.

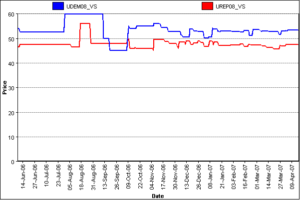
Current development of the share prices of the parties for the 2008 US presidential elections. If similarly representative forums were available for each product, sales forecasts could be much more precise.
In Germany, forecasting exchanges also became known through political elections. In the 1998 Bundestag elections in Germany, a forecast exchange of the company Ecce Terram (www.ecceterram.de) delivered the second best forecast result compared to the election researchers. In a demo application, you can also speculate on the outcome of a possible Bundestag election at short notice. However, the example is so little frequented outside the “election season” that the limits of the exchange mechanism become apparent. Further application examples for forecast exchanges can be found at Hewlett-Packard, for example: their “Information Dynamics Lab” in Palo Alta has successfully tested a forecast exchange as part of a forecasting process for the company’s quarterly results (www.hpl.hp.com/research/idl/projects/brain/index.html).
We are also aware of application examples in German companies, some of which we know from confidential sources and therefore cannot list here. Spann and Skiera refer to an experiment at a German mobile phone provider. In this experiment, a group of 20 selected employees were asked to forecast the demand for five different mobile services for a test month. The forecast accuracy, measured as the mean absolute percentage forecast error, was significantly better than alternative forecast values. However, this experiment was not statistically representative. American applications in particular are publicly accessible and well frequented. For example, a forecast exchange can be accessed via the Yahoo web portal (buzz.research.yahoo.com/index.html), which predicts the development of competing technologies. What technology will flat screens use tomorrow, for example? As I write this, LCD shares are trading at $10.05 and Plasma at $9.95…

The Forecastböse Hollywood Stock Exchange (www.hsx.com) has proven to be very transparent and apparently very effective.
In this “game”, as Yahoo Research itself calls it, share prices are determined on the one hand by the frequency of certain buzz words entered in Yahoo searches and on the other hand by the expectations of market participants. How the two mechanisms interact is not so easy to understand, which brings us to one of the decisive factors of an effective forecast exchange: the transparency of the so-called “cash-out”, i.e. the payout of the speculative success to the exchange participants.
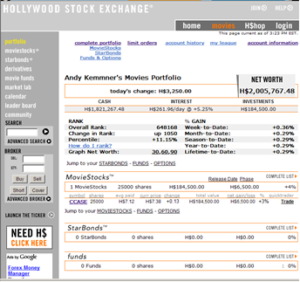
The Hollywood Stock Exchange (www.hsx.com) has proven to be very transparent and apparently very effective. Among other things, MovieStocks® have been traded there since 1996. A MovieStock corresponds to a feature film project. The share price depends on the box office results of the first weekend of a new film. In a market in which the investment in a project can easily correspond to the turnover of a larger medium-sized company, the forecast of the expected box-office takings understandably plays a major role.
The stock market mechanism is simple: traders buy and sell MovieStocks according to their expectations regarding box office results. Trading is suspended on the Friday before the first match weekend. On the following Monday, the share prices will be adjusted according to the first box office results. Traders aim to sell overvalued MovieStocks and buy undervalued ones in order to improve the portfolio value at cash-out. The expectation is that this will result in a prediction value that is as close to reality as possible.
In the middle of the last century, the Austrian Nobel Prize winner for economics, Friedrich August von Hayek, claimed that this expectation is justified in principle. According to his hypothesis, market prices reflect the distributed knowledge of market participants.
Even if this idea is appealing and various experiences with virtual stock markets (VSMs), as they are known in the US, are encouraging, the question arises as to whether the principle can be transferred to the forecasting of market requirements, e.g. for end products.
We have been working intensively on this issue for some time now. We are currently preparing a corresponding experiment for a particularly difficult prediction problem with a renowned major German company. We will be able to report on this in more detail in due course. Irrespective of the specific problems in this particular project, however, the following questions are of interest to any company that wants to tackle the subject of forecast exchanges for its own products:
- What number of shares (= products) can still be traded clearly?
- How many participants are required or can be integrated into your own VSM at all? Can customers and suppliers also be integrated?
- Can uninformed market participants also contribute to the success of the forecast? How do you measure “knowledge”?
- Can the participants cope with the stock exchange mechanism at all?
- Is the participants’ gambling instinct enough to seriously play along and “stick with it” or do additional motivational factors need to be built in, as in real stock trading?
- How good can a prognosis become and when can a prognosis be described as good?
To summarize: Can forecast exchanges be a successful tool for forecasting demand for your company and what are the prerequisites for this? In any case, we believe that under optimal conditions VSM-based forecasts can achieve an accuracy of well over 90%. This is considerably more than the usual 60-70%. The tool can also be designed to be attractive for employees, so that forecasts no longer have to be a tiresome planning burden, but can also raise the level of engagement with the forecasting task to a completely different level. Ultimately, forecast exchanges can also promote internal company communication. In this respect, in addition to the actual results, they also bring to light the exchange of opinions on the results, the measures introduced and their effects, to name just a few examples. However, the major handicap of a VSM is and remains the small number of shares (= prediction objects) that can be meaningfully traded in relation to the number of market participants!
By the way, are you interested in the predictions for the primaries for the Democratic presidential candidates in the USA? The shares CLIN_NOM (Hillary Clinton) and OBAM_NOM (Barack Obama) are trading at significantly higher values than the alternatives. As I write these lines, CLIN_NOM shares are a good 15 points above OBAM_NOM shares. In mid-March 07, when Obama had raised almost as many campaign donations as Clinton, OBAM_NOM shares were even narrowly ahead. The current performance of the election shares can be found here: http://iemweb.biz.uiowa.edu/graphs/graph_DConv08.cfm.

