Monitoring by exception; monitoring the disposition with a key figure system
By Dr. Bernd Reineke
The project to optimize scheduling has been completed. Methods, master data and parameters are set. The target stocks are defined. However, it is not uncommon for optimization targets not to be achieved. Why is that? Have a look! With a suitably tailored system of key figures, you can quickly track down the causes.
Typical supply chain projects, such as those carried out or accompanied by Abels & Kemmner, usually result in fundamental changes to planning and scheduling procedures and their parameters. Sustainable solutions are characterized in particular by the fact that the scheduling procedures and parameters used are constantly updated to take account of changes in demand for products and materials. But this is just one measure. It is not sufficient on its own. Stocks do not “automatically” reach the desired target values, ranges or stock turnover. Without consistent application of the new parameters, no sustainable reduction in stocks can be achieved. What are the problems in practice?
It is not uncommon for dispatchers’ working methods not to change in line with the new requirements, which leads to deviations from the calculated targets. And even if training measures have been carried out with the dispatchers, they are often overwhelmed by the new procedures and their multitude on a day-to-day basis: Why, for example, schedule a C-part on a weekly basis when it is more convenient to order just once a month or quarter? There is also often still a certain mistrust of the new processes, which sometimes leads dispatchers to order earlier and/or more. This creates unnecessary securities. If, step by step, the old ways of doing things creep back in, the potential that has been uncovered recedes further into the distance every day.

The AK-Toolbox is an XML-based solution for the daily monitoring of key figures in scheduling, which is used as part of supply chain optimization processes to sustainably reduce inventories while simultaneously increasing delivery readiness.
Lack of software support
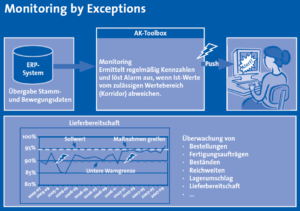
However, the failure to achieve the targets is not solely due to the “misconduct” of the dispatcher. It is impossible to recognize and exploit all the potential of hundreds or several thousand articles per MRP controller for each individual item without the appropriate tools! Abels & Kemmner therefore recommends developing and implementing a key performance indicator system tailored to the area to be optimized at the same time as a supply chain project. However, this does not involve regular evaluations such as monthly inventory reports from Controlling. Instead, a monitoring system should be set up that recognizes every short-term exception (deviation) and reacts independently as required. For this purpose, actual values must be compared with target values for each scheduling-relevant process. Permissible deviations must be specified in advance as a corridor with upper and lower limits. When this corridor is exited, a message is issued which, ideally, is delivered directly to a predefined group of recipients. This can be done automatically and as required with predefined texts by email, SMS or workflow datasheet.
Ordered too early
One of the most common MRP errors is ordering goods too early: the MRP controller has all order proposals displayed within the opening horizon or MRP horizon, which is usually freely selected. If this period is set too long, he receives a long list of order proposals or planned orders. Several suggestions for an article are then often quickly summarized and ordered. Further items are ordered, although this would only be necessary at a later date. The result is that the range of stocks increases precisely around this time, which is ordered too early.
In this case, a monitoring system must be set up that ideally limits the order proposals to an agreed, minimum required opening horizon on a daily basis and compares them with the new orders or production orders. If there are discrepancies between the order proposals and actual orders or production orders in terms of date or quantity, an alarm is triggered and a previously defined distribution group is notified. The distribution list can contain, for example, the responsible dispatcher and – depending on relevance – the line manager. The advantage of this approach is that the supervisor can give very prompt feedback on the current scheduling and show the scheduler the consequences of his actions. As a result, the dispatcher gets to know the expectations of his supervisor better and the supervisor gets to know the dispatcher’s motives for his actions.
Ordered too much
Another mistake is that many schedulers have developed a “love of smooth numbers”. This is expressed by rounding up “crooked” numbers to even numbers. This quickly turns a 7 into a 10, or an 83 into a 100. Quantities are often rounded up to packaging units or transport units. Then 26 pallets suddenly become 32 pallets because they just fit on the truck. If it is actually necessary to round up order quantities, e.g. to packaging or transport units, this must be stored in the master data of the ordering system. However, if the master data is correct and rounding up is nevertheless carried out without authorization, this has unintended consequences that increase the inventory. In this case, the monitoring system could compare the demand with the order quantities and issue an alarm if the required quantities in the orders or production orders are exceeded.
Delivery readiness decreases
Another important key figure for dispatchers is readiness to deliver. This can also be monitored using a suitable monitoring system, with deviations from the target delivery readiness corridor directly triggering an alarm. In this way, it is possible to check immediately how the deviation occurred and what measures need to be taken in response.
To set up the monitoring, the key figures to be collected must be determined together with the project team based on the project objectives – e.g. inventory reduction and delivery capability. The second step is for the project team to determine target figures for the KPIs and define the target corridor (as with a process control chart). It is important to present these targets to those involved and the management and have them approved accordingly so that there is consensus on the target values. The next step is to collect these key figures, which can be automated by using a suitable software tool such as the AK-Toolbox. It is important to collect the key figures regularly right from the start of the project in order to be able to prove the project’s success with reliable figures later on. The definition of the survey rhythms is also part of this. The fourth step involves the implementation and application of monitoring, i.e. the systems generally determine the key figures on a daily basis and sound the alarm in the event of deviations (see also illustration).
To avoid receiving too many exception reports at the start of monitoring, it is advisable to limit the reports to A articles or a specific article group (pilot articles), for example. Once the processes and settings for these articles have been consolidated, further articles can be added until the entire range of articles is ultimately subjected to monitoring.
As it would usually be too time-consuming and costly to implement the key performance indicator system in the customer’s ERP system or data warehouse at the start of the project, Abels & Kemmner uses the project-supporting software tool AK-Toolbox (see box), which can be adapted to specific customer requirements with just a few parameterizations and delivers the reports directly to the screens of those responsible by email.
The use of the KPI system serves as a preventive measure to ensure that the forecast potential for reducing inventories and increasing delivery readiness is achieved in the long term. However, if the pre-defined tolerance corridor is deliberately exceeded and this is documented accordingly, reliable reasons for not achieving the forecast potentials can also be determined, which can be reflected on cyclically in review meetings with the supply chain specialists from Abels & Kemmner. This often results in new starting points for exploiting new potential.
AK-Toolbox
Case-based key figure monitoring made easy
The AK-Toolbox is an extremely flexible solution for the daily monitoring of key planning figures, which is used as part of supply chain optimization processes to sustainably reduce inventories while at the same time increasing delivery readiness. With appropriate parameterization, it detects and reports typical scheduling errors such as
- order quantities are too high,
- orders or production orders are triggered too early,
- the unnecessary build-up of collateral in the form of inventories and delivery times, and
- the merging of order proposals from different time periods.
However, suppliers or the company’s own production also contribute to incorrect planning by
- combine requirements without authorization or
- deliver more than was ordered.
The AK-Toolbox also reliably detects and reports these incidents. Depending on the urgency or relevance, the messages with case-based predefined texts are forwarded online in “real time” as required, e.g. by email, SMS or workflow datasheet. As a result, the dispatcher gets to know the expectations of his supervisor better and the supervisor gets to know the dispatcher’s motives for his actions. Ultimately, the AK-Toolbox, in conjunction with the continuous demand-oriented optimization of scheduling procedures and parameters, ensures a sustainable reduction in inventories while simultaneously increasing or ensuring the highest levels of delivery readiness. The AK-Toolbox thus helps to ensure the sustainable success of supply chain projects.
Procedure for setting up a monitoring system
1. definition of the key figures
- Align with the project goals
- Consider conflicting objectives (e.g. inventory and delivery readiness) equally
- Check availability of necessary data and supplement if necessary
2. determining the value limits and the survey rhythms
- Analysis of key figures and calculation of permissible tolerances
- Derive value limits
- Determine meaningful survey rhythms
- Coordinate key figures and value limits with those involved
3. realize and automate the collection of key figures
- Set-up of the monitoring system within the ERP system, data warehouse or through additional software
- Time or event-driven collection of key figures
- Realize the delivery of messages from the monitoring (e.g. email, workflow, SMS, …)
4. implementation and commissioning of the monitoring system
- Implementing macros, reports and, if necessary, software
- Setting up the addressees for each exception
- Initially restrict to a pilot area and test functionality to gain experience


