By Prof. Dr. Götz-Andreas Kemmner
Inventories tie up capital, usually too much capital that could be used more efficiently elsewhere. Stocks also cost money, usually more money than most of us realized before doing the math. In a statistical average company in the manufacturing industry, a 20% reduction in inventories enables a 48% increase in free liquidity or a 27% reduction in long-term liabilities. These figures clearly show how much entrepreneurial leeway can be created by reducing existing stocks.
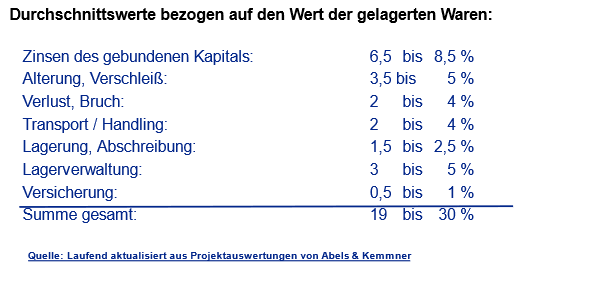
Depending on how the imputed costs of the various items of an inventory cost rate are assessed, the average running costs amount to between 19% and 30% of the inventory costs per year. It has been extremely rare for imputed costs to fall below 15 %.
If you don’t take care of stocks, they will grow. This is an old experience and there is a simple reason for this:
Basic principle 1: Overstocking is convenient and has many secret sympathizers.
Stocks are an effective logistical lubricant. The purchase prices in Asia are so cheap? We don’t want to cut back our product portfolio, maintain our material master data, set up our scheduling system correctly, keep our production running at full capacity, worry about our customers’ requirements and get into trouble with them? Great, then we’ll just add a few scoops of stock and get rid of the hassle. Like some sweets, stocks are pleasant for the soul. Success in inventory management begins with us constantly identifying our own excess stock.

A popular approach to identifying excess stock in the company is the dregs analysis. In inventory management, a sediment is the stock that has never been attacked during a certain observation period. This corresponds to the lowest level of stock held during this period. At first glance, it seems plausible to regard stock that has not been used in the last 12 months as unnecessary stock and therefore as excess stock. On closer inspection, however, this consideration is too simple. Just because you haven’t needed your household contents insurance in the last 12 months doesn’t mean you should cancel it immediately. A certain level of safety stock is required to ensure a certain level of delivery readiness. Ultimately, this is a statistical figure that takes into account the probability that you will unexpectedly require certain larger quantities. There is no systematic correlation between the required safety stock and the existing sediment. The required safety stock can be significantly higher than the sediment, but it can also be lower. In the first case, we would have to add stock to the sediment; in the latter case, the excess stock consists only of the difference between the safety stock and the sediment.
If the sediment is not suitable as an assessment variable for overstocking, what remains? If the quality of the planning is right and the necessary data material is available and can be analyzed, it is possible, for example, to compare the average stock of the past with the average stock of the future for each item. The average future stock would result from the settings of the planning parameters and the required safety stock. However, this ideal future-oriented calculation of the average stock does not reflect a real picture, as there are too many disturbance variables that affect the disposition and are not taken into account in an idealized view of the future.
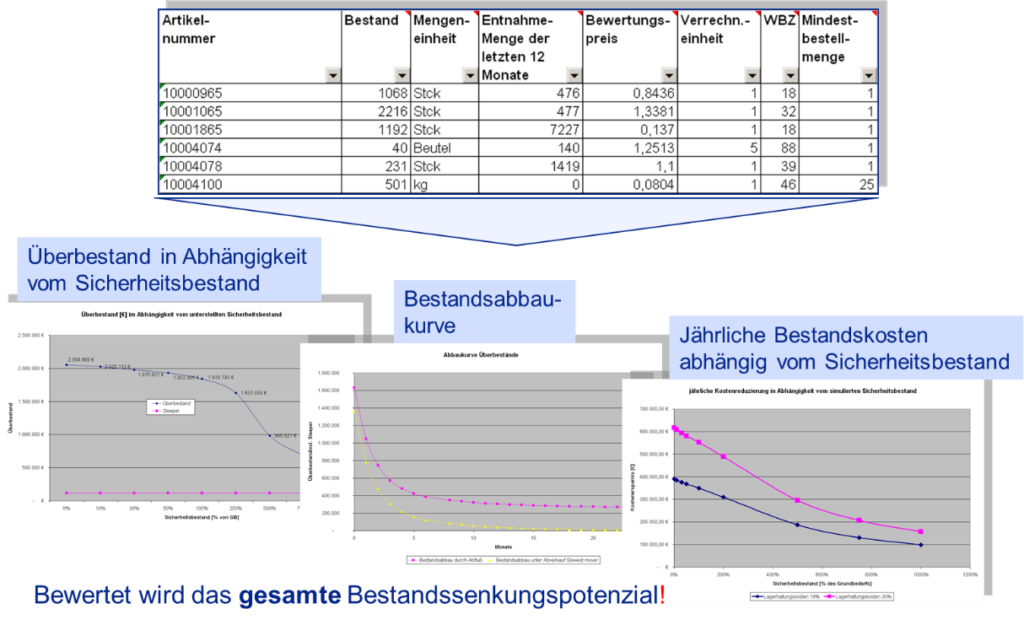
With the E:S:A method, we developed a simple calculation mechanism for excess stock several years ago, which we recalibrate on an ongoing basis. We make the E:S:A procedure available to interested companies in return for consent to process the key figures anonymously in statistics. Disadvantage of this method: For statistical reasons, no statements can be made about individual articles, but only about the total excess stock of a storage level. Where exactly the stocks are located and what caused them still needs to be found out. We will discuss a more detailed, but also more complex examination of item-specific excess stock at the end of the text.

Let’s take a look at the first best-practice building block of inventory management:
Best practice module 1:
Successful companies determine their excess stock in a targeted and regular manner and not the bottom rates of items.
Regardless of whether you are gambling with floor rates, working with average stock comparisons or using E:S:A analysis: It is always important to find out what caused the overstocking. Overstocks are like headaches, they are not just headaches, they are ultimately just symptoms of the actual causes that need to be recognized.
Once you have identified an item with actual or perceived excess stock and ask about the causes, you will inevitably come across
Basic principle 2: Every surplus stock has a history… and sometimes it’s not made up.
Overstocks are not the result of intent, i.e. quasi sabotage, but of wrong considerations and decisions, some of which may have seemed completely correct at the time of the decision.
The best way to determine which overstocking was unavoidable and how it could have been avoided is to bring together all the functional areas that contribute directly or indirectly to the stock levels of the items in question in workshops. In such “inventory driver workshops”, the inventory levels of critical items can be examined from different perspectives in order to identify the possible causes of inventory.
Inventory driver workshops initially lead to situational improvements that often make it possible to reduce inventory in the short term. Regular inventory driver workshops therefore represent the second best practice component: Best practice building block 2: Regular inventory driver workshops can help to identify the structural causes of excessive inventories and highlight short-term remedial measures.
If you regularly conduct inventory driver workshops, you will know that the main inventory drivers are of a structural nature. Some of these can be identified during the portfolio driver workshops. However, knowing them does not mean that they have been eliminated. Perhaps you have already experienced that you keep coming up against the same structural inventory drivers, even though, theoretically speaking, there are an infinite number of inventory drivers. Measures to overcome the main structural portfolio drivers are indispensable best practice building blocks from which the building of sustainable portfolio management is constructed. In the following, we will look at the most important of these structural portfolio drivers.

If we start at the beginning of the planning chain, we realize that many of our companies act in a rather “haphazard” manner. In terms of sales, the company worked out where it wanted to be at the end of the financial year in terms of turnover and how turnover should be distributed across the individual product groups. With regard to the individual material to be planned, however, there is no precise idea of which requirements should actually be taken into account. However, the material flow in the company works at this level. If this gap is not properly closed, you are in breach of…
Basic principle 3: Only those who know which way the wind of demand is blowing can set their production sails accordingly.
There are various ways to improve the demand forecast. In each case, statements must be made about the individual planning object at the logistical decoupling point. The logistical decoupling point is the storage level downstream of the value stream, up to which production is customer order-neutral and from which production is customer order-related. There may be different decoupling points for different material numbers. At the respective logistical decoupling points, stocks must be built up for the respective planning objects. Depending on the position of the decoupling points, the planning objects can be end products, assemblies or individual parts.
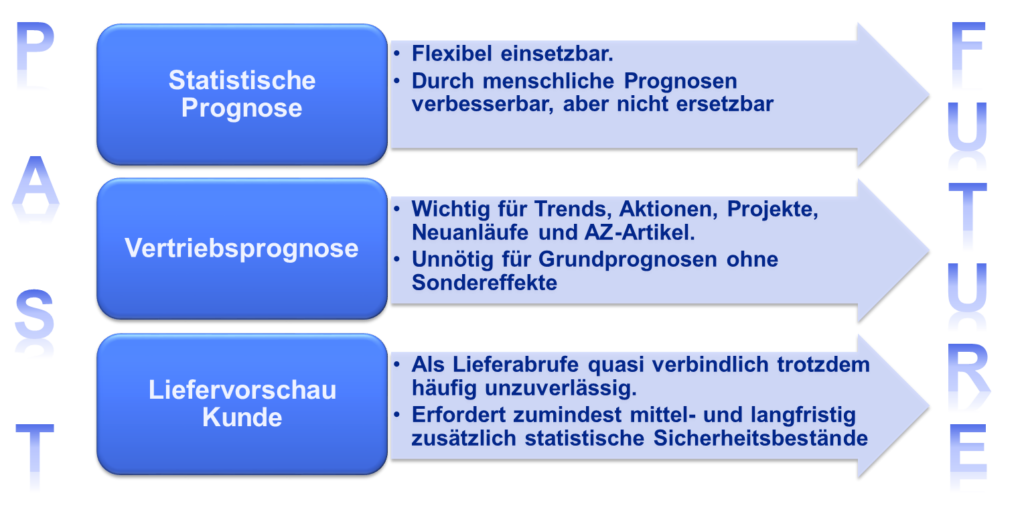
In order to arrive at meaningful figures, there is usually no way around statistical forecasts, which may or may not be based on the actual figures. must be supplemented by further information from the sales department, e.g. promotions, projects and generally expected market growth.
Classic forecasting methods, such as those you may be familiar with from your ERP systems, must be supplemented by distribution-free methods and supported by simulation mechanisms in order to achieve reliable forecast values.
Best practice module 3:
Leading companies in inventory management have identified and implemented the key levers for improving their sales and demand forecasts.
Reliable sales and demand forecasts are an essential basis for better planning. As necessary as improved demand forecasts are, they are not sufficient for sustainably effective inventory management, as the scheduling department is constantly struggling with…
Basic principle 4: When it comes to material planning, reason is often overwhelmed and the gut is a bad advisor.
One objective when introducing your scheduling system was certainly to enable employees to plan “better” because the system provides “better” scheduling suggestions for procurement and production control. “Better” in this context means that users do not have to constantly adjust the scheduling proposals in terms of quantity and date, but can simply confirm them as far as possible.
Later practice often looks different: Users are still constantly tinkering with the proposals. In some cases, this is essential, as most of our companies repeatedly experience disruptions that were not taken into account in the system’s scheduling proposals. In some cases, the system’s scheduling suggestions could have been better if the master data and system parameters had been set to suit the situation, and in some cases scheduling suggestions are overridden because they contradict gut feeling.
Users are often blamed for incorrectly set master data and system parameters. However, they are completely overwhelmed in terms of time and expertise when it comes to making the right settings.

A simple calculation example makes it clear how great the effort would be for careful master data maintenance by the user: even if you only want to maintain essential parameters of an article, you quickly come up with 8 to 10 values and settings per article (replenishment time, minimum lot size, jump lot size, minimum stock, goods receipt processing time, lead time, safety time, MRP procedure, lot-sizing procedure, planned value distribution, allocation intervals, target readiness for delivery, MRP mode (automatic/manual),…). ) and we already assume that the forecast procedure and safety stock procedure as well as the complex size of the safety margin are determined by the system.
With 1000 articles for which a dispatcher is responsible, this means, let’s say, 10,000 data fields that have to be viewed at least twice a year and, if necessary, updated. would have to be changed. With an average of just one minute per data field for calling up, checking, considering, calculating and, if necessary, changing, this results in a time requirement of 20,000 minutes, corresponding to two working months per year. With 3,000 articles, it would already be six months of annual maintenance work and with quarterly instead of half-yearly maintenance, one person would already be working full-time on the data maintenance of these 3,000 articles.
In addition, the interaction of the individual parameter values is so complex that the user is quickly overwhelmed and cannot find the best economic setting without additional aids. Ultimately, many users tend to revise scheduling suggestions because they trust their gut feeling more than the system’s suggestions.
Companies striving for successful inventory management must overcome these problems and establish effective and efficient scheduling.
The following applies:
Best practice module 4:
Sustainable inventory management requires reproducible and economical scheduling decisions. This can only be achieved if sets of rules and simulation mechanisms ensure that processes, parameters and master data are set to suit the situation and if the user’s gut feeling is suppressed.
Subjective, gut-influenced decisions are also a major cause of the often perceived “stress” in the supply chain, because we overreact to changes in demand in the value chain and consequently struggle with the effects of Basic Principle 5:
Basic principle 5: Hectic steering and oversteering in the event of fluctuations in demand and supply causes the supply chain to vibrate.
Every yacht sailor knows the effect: a large yacht reacts rather sluggishly to the rudder. Many try to accelerate the course change by turning the rudder more strongly, which is only partially successful on the one hand, but on the other hand leads to the ship turning “with momentum” once it has turned and reacting even more slowly to the opposite rudder position. The result is not a straight course, but a snaking line along which the ship moves.
We are familiar with the same effect from the practice of inventory management. Reactions to item-specific overstocks or shortages are often far too hectic and overcontrolled. Once the increased flow of goods from the supplier starts to flow, attempts are made to slow it down by drastically reducing order quantities, after which the cycle starts all over again.
If we transfer the sailing experience to the practice of inventory management, then it is important to react cautiously and not excessively in order to dampen inventory fluctuations. In the case of live items, the cause of stock fluctuations is primarily due to fluctuations in demand in the upstream stages of the value chain. It is important to react to these with caution by cushioning increases in demand with a safety stock, consistently and promptly passing on information about declines in demand within the company and always reordering more cautiously when demand increases than corresponds to the initial increase in demand, or always reducing stocks more cautiously when demand decreases than corresponds to the decrease in demand.
Unfortunately, another insight from sailing can also be applied to inventory management: there are sailors who get the hang of rowing within a short time and others who never learn it for the rest of their lives. We have often seen similar things in operational practice. When sailing on cruising yachts today, the autopilot provides a remedy, taking over the steering and generally doing it better than humans. In the practice of inventory management, the set of rules represents the autopilot.
Reacting hastily may be a good idea. help your own inventory management in the short term. Unfortunately, however, the resulting fluctuations spread through the interconnected supply chains and ultimately affect the company itself. As the costs of a supply chain are borne by all participants in the long term, the costs therefore increase for everyone.
It is therefore very important to note this:
Best practice module 5:
The effective stability control (ESC) of sustainable inventory management consists of short-cycle but moderate reactions to changes in demand, supply or production.
It is not only unsuitable scheduling rules and mechanisms, subjective decisions and a tendency to overcontrol that drive inventory, but also the incorrect decoupling of inventory and scheduling levels. This is a very multifaceted topic, which we want to address in the next issue of POTENZIALE.
Further information on the E:S:A overstock analysis can be found here.
You can find special best-practice modules for sales forecasting here: http://bit.ly/1DYNLbI
You can find special best-practice modules for scheduling here: http://bit.ly/AKBR1993

