The coronavirus crisis has had very different effects on companies’ inventory management. For some companies, demand collapsed, for others it took off. At least the former, but in practice often also the latter, are struggling with significant overstocks; overstocks that cost important liquidity, because “cash is currently king”. From many years in corporate restructuring, I know that many manufacturing and trading companies that have become insolvent were actually swimming in money. Money that was not in the account, however, but was tied up in surplus stocks. Why many companies are blind to their own excess inventories, know nothing about them and do not want to admit to them, remains one of the great mysteries of practice for me. It is neither time-consuming nor expensive to quickly obtain a good overview of the condition of your own stocks. For many years, we have been using the E:S:A method developed by us for overstock analysis. We have recently added another key figure to this, the BMI inventory management index.
Reducing inventories is crucial for many companies on their way out of the coronavirus recession. Without sufficient liquidity, the way out of the crisis will not be successful and it will not be possible to avoid every bottleneck with subsidies and favorable loans alone. The joint study by Abels & Kemmner and the Arbeitsgemeinschaft für wirtschaftliche Fertigung (AWF) on supply chain management after corona also shows that inventory reduction is an important topic.
But how can excess stock be quickly identified without having to go into detailed data analysis? Of course, you can’t do it completely without data. However, the E:S:A analysis only requires a small amount of master data for each item and supplements this with statistical parameters that have been determined in numerous detailed stock simulations. The result is a conservative, safely achievable inventory reduction potential for an inventory level or an entire value chain that does not jeopardize delivery readiness. The stock reduction potential is broken down into different types of excess stock, stock reduction curves are determined, earnings potential is determined and target figures are calculated.

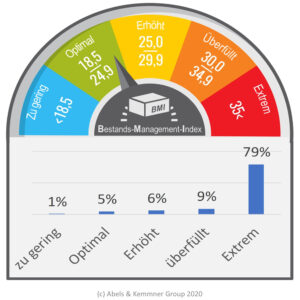
If you are struggling with excess stocks, it is not only the absolute level of excess stocks that plays a role, but also the stock dynamics. The faster overstocks can be reduced, the faster a company can correct its misallocations. Unfortunately, our benchmarking database does not paint a praiseworthy picture in practice. In 79% of the companies surveyed, the BMI (inventory management index) falls into the extreme range. The best quarter of companies achieved an inventory management index below 38, while the worst quarter scored above 68; there is still plenty of room for improvement here.
Many managers may feel insecure about giving out their own company’s data. For this reason, we have redesigned the E:S:A analysis process in recent months so that companies can carry out the data preparation for the analysis themselves. Detailed data does not have to be passed on to us. Like a test laboratory, we only evaluate the summarized data. We are providing this service free of charge until the end of 2020. Further information and registration for the E:S:A analysis can be found at: Short analyses.
Let’s hope that the turbulence of the coming months does not once again drive many companies into illiquidity that are actually sitting on assets.
Featured image: Adobe Stock

