Lagerbestände sind totes Kapital und kosten Geld.
Inventory management analysis 2021 | Series and variant manufacturers and wholesalers invest an additional 19 to 30% of their average inventory value in warehousing costs each year (Fig. 1). As a result, the profit can be increased by up to 30% of the reduced inventory value when inventories fall and can release up to 100% of cash and cash equivalents.
The best starting points for reducing stock levels are strategic stock analyses using logistical simulation and improved sales forecasts based on these, as well as the correct setting of planning and scheduling parameters in the ERP or merchandise management systems. This is confirmed by Abels & Kemmner’s rolling project evaluation.
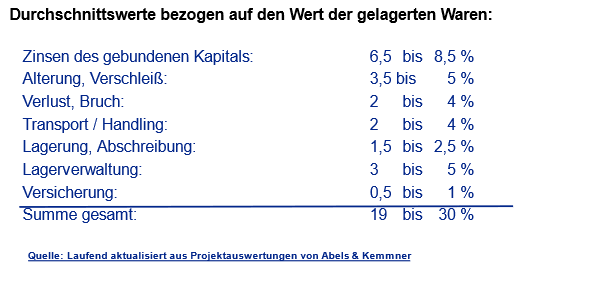
Fig. 1: The level of warehousing costs is determined by a whole range of parameters.
Although all companies, including SMEs, now work with ERP or enterprise resource planning systems, the share of inventories in total assets in the manufacturing industry has remained virtually constant since 2009, whereas it fell significantly between 1997 and 2008 (Fig. 2).
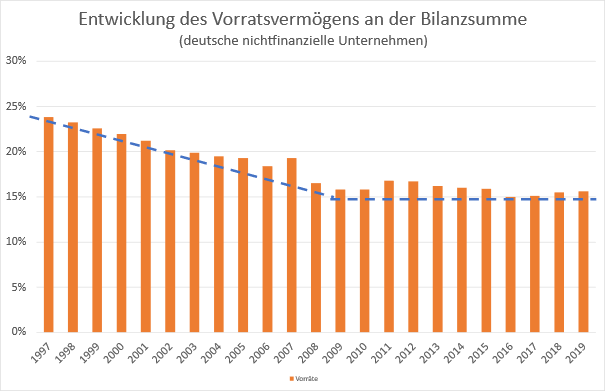
Fig. 2: Development of inventories as a percentage of total assets of German non-financial companies from 1997 to 2019 (latest figures) www.destatis.de
Although the materials management systems used support the dispatchers, they rarely offer sufficient analysis functions and optimizations for inventory management. In addition, the necessary analytical work can often not be carried out by the companies themselves, as day-to-day business does not allow the time. With relatively little effort, however, a large proportion of stocks and therefore costs can be reduced while at the same time ensuring delivery readiness, as our project experience has shown time and again.
Bestandsmanagement Analyse 2021 zeigt deutliches Einsparpotenzial
In order to identify potential for improvement, we structure our work into so-called Situation analyses materials according to importance and predictability. Criteria used include, for example, the proportion of sales, the stock level, the level of service, but also investigations into trends, seasonality and similar. This information then flows into an ABC-XYZ analysis and allows the articles to be structured or grouped accordingly. For each article group, the following are calculated using Simulation and automatic optimization suitable planning and scheduling strategies as well as precisely adjusted scheduling parameters. The required stocks are then calculated using simulation.
Our inventory management analyses 2021 show an average savings potential of at least 15% for 82% of the companies analyzed. In 32% of the analyses, even more than 25% of the stock can be saved. The largest cluster with 43% of companies can save between 20 and 25% (Fig. 3).
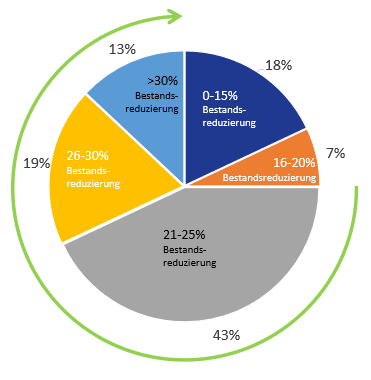
Fig. 3: At least 20% of the inventory can be reduced in 75% of the companies analyzed
Was sind die wesentlichen Herausforderungen im Bestandsmanagement?
The main reasons for the existing Optimization potential is that companies rely on the MRP parameters once they have been set during item creation, do not have the necessary know-how to adjust the parameters correctly, underestimate the time required to maintain the MRP parameters manually or are not prepared to invest in the strategic optimization of inventory management.
An examination of the situation often reveals deficiencies in the following specific areas:
- When new ERP systems were introduced, preset parameters were adopted by the implementation consultants without a company-specific review;
- If scheduling parameters have been deliberately set, they are often based on outdated data;
- the forecasting and planning methodsused are often not suitable for the stock issue behavior of the items concerned;
- Many ERP systems still only offer simple, inadequate inventory planning procedures;
- Important uncertainty factors in material inventory planning (excess consumption, delivery delays or underdelivery) are not sufficiently taken into account.
Many of the calculation methods commonly used for inventory planning (mean value, exponential smoothing, etc.) assume normally distributed stock removals without taking the actual distribution into account. In practice, however, there are different distributions of outsourcing. Random analyses repeatedly show that the proportion of articles with a normal distribution is only around 5%.
However, a relatively large proportion of the observed statistical outsourcing distributions (approx. 25%) cannot be assigned to any of the theoretical distribution types we usually examine (Fig. 4). In these cases, it would be correct to use so-called distribution-free methods for sales forecasting and safety stock determination. However, ERP and merchandise management systems usually ignore this fact.
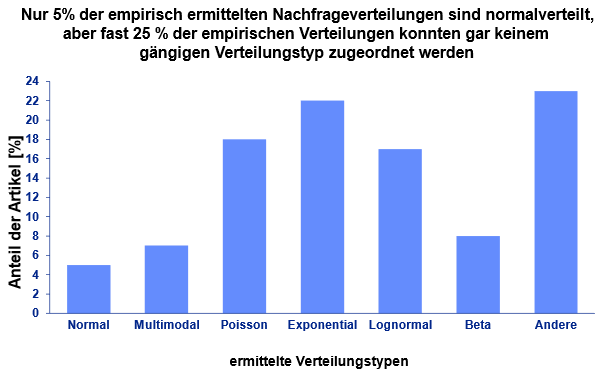
Fig. 4: Example analysis of the frequency of different forms of demand distribution in a product portfolio
Fazit der Bestandsmanagement Analyse 2021
By developing a company-specific forecasting and replenishment strategy and setting the right replenishment parameters in ERP systems, you can increase your readiness to deliver and thus ultimately your turnover, while reducing your inventory costs and strengthening your competitiveness in the long term. At the same time, market-oriented corrections make it possible to streamline the product range to what is actually necessary.
In our opinion, the best approach for recognizing the need for action and determining the associated potential is an empirical simulation, as regularly and successfully carried out by Abels & Kemmner.
Menschliches Handeln gepaart mit Simulation und künstlicher Intelligenz verbessern das Bestandsmanagement
Decades of experience with the challenges described have been incorporated into the APS and ERP optimization system DISKOVER SCO. DISKOVER is an add-on system that supports operational and strategic scheduling.
Distribution-free calculation methods for forecasting demand and determining safety stocks, supplemented by modern AI methods, efficiently overcome the obstacles described above. An automatic article-specific empirical simulation identifies the optimum process variants and parameters for each article.
What are your experiences with the Inventory Management Analysis 2021?