The inventory turnover rate is a key figure in inventory management that expresses how many times per year the stock of an item is renewed.
The inventory turnover rate is calculated from the annual turnover or the annual consumption value divided by the current or average stock level at the time of calculation. The last 12 months are typically used on a rolling basis to determine the annual turnover or annual consumption value.
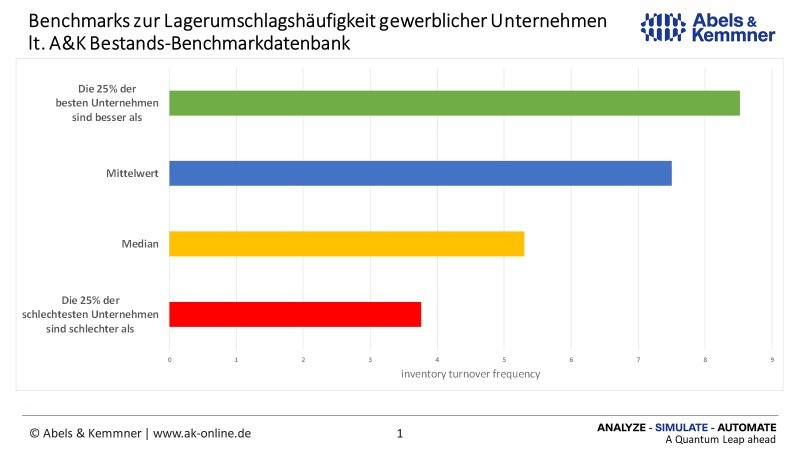
According to A&K’s inventory benchmark database, the average inventory turnover rate, calculated across all items in a company, is 7.5 and the median is 5.3. The 25% of the best companies have an inventory turnover of more than 8.5, while the worst quarter of companies have an inventory turnover of less than 3.8.

Our tip:
To avoid comparing apples (= stock issue quantity at sales prices) with pears (= stock on hand at production costs), you should calculate the inventory turnover rate from the quotient of consumption value (= stock issue quantity * production costs) and stock on hand.
If the turnover rate is calculated from rolling figures for the past 12 months, the key figure is sluggish. To display developments more dynamically, you should consider whether a rolling three-month view is not more suitable. In this case, you should calculate the denominator with the average stock level of the last three rolling months and form this at least from the three month-end stock levels, or better from the weekly or daily stock levels.

