Increasing the efficiency of the supply chain
By Prof. Dr. Götz-Andreas Kemmner
Increasing the efficiency of the supply chain and at the same time automating planning and scheduling processes as much as possible is a challenge for any supply chain management. With the help of COLT analysis, this goal can be consistently and continuously targeted and developed into ERP performance management.
The COLT value is the Cost Optimal Location Turn Rate. This parameter includes the three most important parameters of every supply chain, namely (average) stock, storage costs and readiness to deliver.
A COLT for all occasions
The COLT value is a key performance indicator( KPI ) and does not indicate an actual value, but rather a target or target value that should be achievable in a value chain if all ERP parameters are set to the optimum economic level and “intelligent” planning is carried out. In this context, “intelligent planning” means that the user changes as much as necessary and as little as possible in the scheduling proposals of the ERP or scheduling system. In practice, it is often necessary for users to override the ERP system’s scheduling suggestions, even if the parameters are set optimally, because they have information that the system does not have. However, there is a great risk that users will intervene in the scheduling suggestions based on years of experience and habit, even when this is not actually necessary. The “intelligence” of manual intervention lies in distinguishing between necessary and unnecessary intervention. However, user intervention may also be necessary because an ERP system cannot be fine-tuned sufficiently. In this case, an ERP optimization tool, such as DISKOVER SCO from SCT GmbH, may have to take over the scheduling task.
From ALT to COLT
We will see later that certain prerequisites are required to determine a COLT value for an inventory level, a plant or a plant group. Before determining the COLT value and thus your own target, the question arises as to where a company, location or production stage stands today. An ALT value can be determined quite simply for this purpose. ALT stands for Actual Location Turn Rate. This value is calculated as the quotient of the consumption values and the average inventory value of the unit under consideration. It evaluates the quality of the interaction between the ERP system and dispatchers or production controllers.
Ultimately, another key value can and must be determined for an existing value chain: the technical turn rate (TTR). The TTR value describes the turnover rates that would be achieved if the scheduling proposals of the ERP system were strictly adhered to as they are currently set.
The COLT value, TTR value and ALT value are often worlds apart for two reasons:
On the one hand, as already mentioned, the order proposals automatically generated by the ERP system are often unnecessarily intervened in manually by the dispatchers. On the other hand, the scheduling parameters are all too often completely under-maintained and therefore outdated. Of course, this does not exactly have a positive effect on the reliability of the automatically generated order proposals and justifies a certain amount of mistrust on the part of the dispatchers. In the end, the cat bites the tail here: the parameters in the ERP system are not set correctly or are out of date, the order proposals are correspondingly inadequate and no one takes the time to maintain the parameters due to the constant “reworking” of the proposals.
If the caliber is not right
So how do you calculate the COLT value for the existing supply chain configuration? The basic prerequisite for this is dynamic, time-based values, as only these reflect a realistic picture of the situation. The frequently used static calculations, for example based on value stream analyses, unfortunately do not reflect reality, as very few manufacturing companies or wholesalers have to deal with static inflows and outflows in their value chain (see Fig. 1).
.
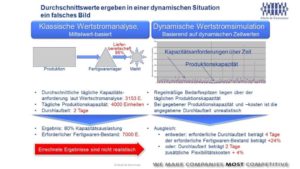
The example in Fig. 1 shows that a classic static value stream calculation would lead to completely incorrect characteristic values.
A simple value stream calculation is also wrong because the number of parameters that influence the scheduling decision and thus ultimately the inventory, delivery readiness and costs of a value chain is very large and goes far beyond the parameters that the user could even set “on the surface” of his ERP system.
The following list of parameters, which are described differently in different ERP systems, may give you a small impression:
- Rounding values
- Forecast weighting
- Safety stock
- Forecasting method
- Forecast period
- Safety stock procedure
- Deviation procedure
- Forecast distribution
- Consumption and adjustment procedures
- Retroactive/anticipatory consumption procedures
- Cross-period consumption
- Calculation method for basic consumption
- Safety stock factor
- Minimum stock
- External MRP type
- MRP procedure
- Batch size procedure
- Fixed order costs
- Storage costs
- Pre-purchase period
- Total lead time
- Order opening period
- Order lead time
- Delivery time
- Incoming goods-related processing time
- Minimum lot size
- Lot size increment
- Maximum batch size
If the simple arithmetic of value stream calculation is not enough, you might think that you could at least derive the target values for inventory turnover from the ERP system itself. After all, ERP systems can project the inventory development of each individual item or material into the future, taking into account all set scheduling and logistics parameters. However, this extrapolation in the ERP system assumes that requirements arrive as predicted and that there are no disruptions.
Under these fictitious boundary conditions, a stock turnover value can actually be determined from the ERP system’s forward projected planning proposals. However, for the reasons already mentioned, this value is only of a purely theoretical nature and can only be achieved in practice by chance at best. The resulting “Fictional Turn Rate (FTR value) is often used in practice as a target value for users, but has absolutely no relation to reality!
Unfortunately, there is only one approach to achieving realistic and reliable parameters and target values: a dynamic value stream simulation based on historical data.
Determine the right caliber
Using a dynamic value stream simulation based on the real historical demand curves, the behavior of each purchased part and each finished part can be simulated individually. The classic approach is to take the daily customer order values or, alternatively, the consumption values of the last twelve months, simulate the forecasting and scheduling process and check which key values could have been achieved in terms of average stock, costs and readiness to deliver.
Such a simulation can also be instructed as to which planning and scheduling parameters it should optimize and what the actual optimization target should be:
- Achieving the target delivery readiness level with the lowest possible inventory level
- Achieving the target delivery readiness level at the lowest possible cost;
(the COLT value is optimized to achieve this goal) - Achieving the lowest possible costs with a simultaneous compromise between delivery readiness and inventory levels
The result of the dynamic value stream simulation is a large number of other key performance indicators as well as article-related turnover rates in relation to the desired readiness for delivery. If such a simulation is run with the existing ERP settings, the result is the Technical Turn Rate (TTR value) described above. If you adjust the parameters in an effort to optimize the settings, you can determine the consequences that would result from changing the parameter settings. In this way, the performance and profitability of the value chain can be systematically improved and the associated COLT values determined.
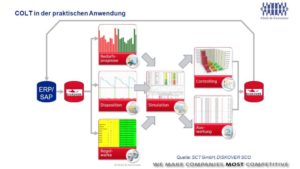
What may sound theoretical here is already being used successfully by many companies, including SMEs (see Fig. 2). However, this requires a suitable system that receives its data from the ERP system and can therefore carry out the corresponding simulations in the background.
Aiming correctly with the COLT
We now know how to create the COLT value and what the real purpose of the exercise is, namely to optimize the entire supply chain. Examples of our own calculations from the practice of various companies should clarify the application.
Let’s start with the question of how well our supply chain could work if we only knew exactly what we were facing. This is exactly what the ERP systems make the dispatchers believe and the dispatchers know that this is not going to happen.
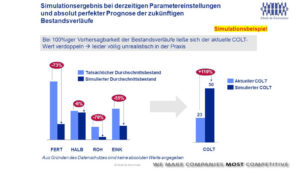
The simulation example (see Fig. 3) compares the current average stock level of a plant with the average stock level that would be achievable if the forecast values expected by the ERP system were accurate and the production and order proposals of the ERP system were implemented exactly; a fairy-tale state, so to speak: the Fictional Turn Rate, the FTR value.
In this case, it turned out that finished goods inventories, for example, could have been reduced by 73%. In relation to the entire plant under consideration, the inventory turnover would have increased from 23 (ALT value) to 50 (FTR value).
Complete fantasy? Right, but the imagination of the ERP system! These target values for average stock levels and stock turnover would have resulted if the data from the ERP system had been extrapolated into the future and used to determine a target value for the plant or MRP.
With the dynamic value stream simulation described above, things can be viewed more realistically. Fig. 4 shows the optimization potential for the same plant that could realistically be achieved using the existing scheduling settings and logistical parameters. Here, the inventory reduction potential for finished goods is only 2% (instead of 73%), but still 33% (instead of 55%) for purchased parts. Stock turnover could be improved from 23 (ALT value) to 27 (TTR value). This simulation shows that even with existing parameter settings in the ERP system, performance would improve if users were to intervene less frequently in the system’s scheduling proposals. The stock turnover of 27 is by no means the cost-optimized COLT value, but only the TTR value that results from the current parameter settings.
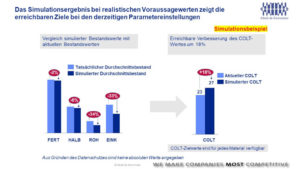
An improvement in stock turnover of 18% is certainly not a potential to be sneezed at, but it is a far cry from the theoretical figure of 50, which would have been completely absurd as a target for scheduling.
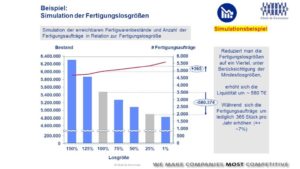
Simulations of the type described can also be used to analyze target conflicts between different target variables in order to derive the correct setting parameters. The example (see Fig. 5) shows how the number of production orders in a year and the average stock of finished goods downstream of production would change in a production area if production were carried out with different batch sizes. This clearly shows that it would make sense to reduce production batch sizes to a quarter of the current batch size. This would only require one more production order per day per year, but would free up almost € 600 thousand in liquidity.
Accurate through regular maintenance
The simulation examples may give a first impression of how the simulation of COLT values can be used to work on the continuous economic improvement of the supply chain. In the simplest application case, it is possible to determine for a single item how changes in MRP parameters would realistically affect the key values of this item, and not idealized extrapolated by the ERP system. Instead of just for one article, the COLT simulation can also be carried out directly for all articles or at least certain article groups in order to determine the overall effects of different MRP settings.
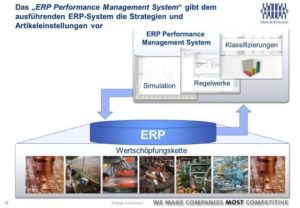
However, the COLT simulation can go even further and directly determine the optimum setting value for parameter settings. The automatic determination of optimum setting values is of great importance in order to achieve sustainably effective improvements and thus sustainably achievable COLT values. It is not enough to optimize parameter settings once for different articles and set them permanently. The settings must be constantly updated via scheduling control systems and certain parameters, such as those that control the forecast and safety stock calculations, must be optimized time and again. For this reason, in many cases such a simulation system is used not just once, but as an ongoing optimization tool for an ERP system, resulting in an ERP performance management system (see Fig. 6).
What is your ERP performance management situation? Are you still muddling through or are you already optimizing?
Image by THAM YUAN YUAN on Pixabay

