Helmut Abels¹, Andreas Gillessen²
Entrepreneurs and sales employees are hopeful characters. They believe in the future and expect that their ideas can be realized. However, because planning is based less on hopes and more on plausibility, a controller prefers to calculate using reliable data and mathematically supported methods rather than adopting sales forecasts based solely on sales estimates. However, neither the visionary nor the empirical planning method leads to optimal results in corporate planning. It is therefore necessary to systematically synchronize the desired targets with the planned figures. This requires a sure instinct as well as methodological expertise and the right tools.
1. problem definition
Although a numerical analysis fulfills the requirement of mathematical precision, it cannot replace the entrepreneurial aspect of actively shaping the future. It is therefore necessary to incorporate the expertise, experience and intuition of employees who deal with market developments on a daily basis into sales planning. Market and opinion researchers refer to this as the Delphi method. The function of the Pythia of Greek mythology is assumed by the sales staff. However, in order to survive in the market, they need a great deal of optimism, which often shapes their sales ideas accordingly. It is therefore best practice to base sales planning on an additional mathematical-statistical analysis of historical data. In practice, it has proven to be a good idea to approximate the two planning results iteratively, whereby the sales department revises and corrects the forecast based on past figures and, if necessary, plans additional sales campaigns.
Don’t gamble away trust with incorrect forecasting methods
In order to achieve the highest possible acceptance of the controller’s figures by the sales department, it is necessary to use the right methods. However, there are a number of mathematical-statistical methods that are suitable under defined prerequisites and conditions. Which method from the “toolbox” of statistical mathematics should be used in which case is, however, often a classic overload for planners, because even if they are familiar with the methods, time pressure often prevents them from analyzing and selecting the right method. However, if the wrong calculation method is chosen, mathematical-statistical methods have the fatal disadvantage of delivering unusable results. This not only leads to problems with delivery readiness and/or excessive stock levels, but also to acceptance problems among sales staff.
A supporting IT-based forecasting system is therefore required, of which several are available on the market today. When selecting such a system, attention should be paid to method simulation functions. The system should be able to examine series of figures from the past in order to determine which forecasting method stored in the “toolbox” is best suited to past real developments. By forecasting a period for which the real data is already available, the forecast results must be compared with the actual trends. Only after this validation of the forecasting method can one rely on the planning reliability of the calculated figures.
Corporate planning from sales forecasts
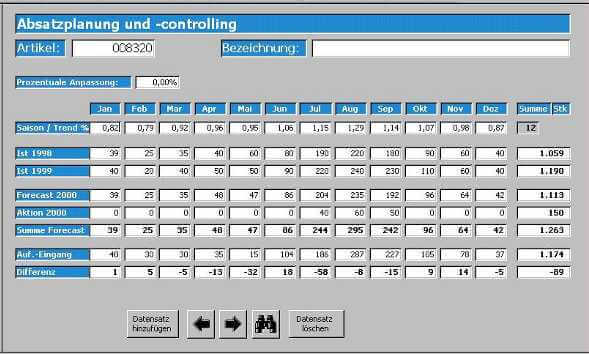
Once the correct forecasting method has been found, the actual forecast calculation should be started. The historical data trends are analyzed for each product or product group. The results are processed and presented in tabular and graphical form. When preparing the figures, care should be taken to ensure that the calculated seasonal factors and trends remain visible.
When the spark ignites
The sales forecast calculated from historical data should serve as an ignition surface in sales to generate discussions about the possibility of sales increases or decreases in individual goods, product groups or customer groups. For this reason, the figures should be prepared in such a way that they are understandable for sales and that they emphasize the most important sales leaps. During the discussion of the figures, the competence and acceptance of the sales manager should be utilized, who can intervene to correct any discussions that go wrong. This approach also defuses the eternal controversial issue of the sales target for the next year: an argument that no sales manager can ignore. The processing time for the sales forecast in Sales should take approx. 2 weeks in October. The prepared figures are then available in November, the typical planning month in Germany, and can be used for corporate planning and decision-making.
The iteratively determined sales planning results in the marketing plan, which in turn leads to the rough production planning, which in turn leads to investment planning with financial accounting and personnel planning. The effectiveness and thus the cost-effectiveness of production can be significantly increased by specifying stable marketing data. This is self-explanatory for every production manager from their previous problems. By investing wisely in the right products and product lines, losses of funds are minimized in both marketing and production.
Market early warning system
The greatest benefit for a company from the system described here may not even lie in the opportunities for cost reduction resulting from improved corporate planning, but in the development of a market early warning system. Underfulfillment and overfulfillment of the last forecast sales volumes are evaluated on a monthly basis. The structure of the process organization requires mandatory declarations from sales management to investigate these deviations. In the interests of rolling sales planning, the sales forecast should be reviewed monthly or quarterly on the basis of the new actual figures and adjusted if necessary. It should be possible to react to market changes immediately but without rushing. This applies to all affected areas of the company.
Readiness for delivery
In order to realize the goals of corporate planning, it must be possible to serve customers. It is therefore essential to ensure that the necessary readiness to deliver can be achieved. In addition to the forecast values, the safety stocks to be maintained in order to achieve delivery readiness must therefore also be determined in cooperation with the planning and purchasing departments. These serve to cushion deviations that exceed the planned consumption of a product. The calculation of these safety stocks also determines the level of a company’s actual inventories. Their influence on sales and earnings can sometimes be very high. It is therefore important to determine them using distribution-free methods, which offer considerable advantages over the distribution-based methods usually used in achieving minimum stock levels at the required level of readiness for delivery. Distribution-free processes can be used in particular. can be used for articles for which no theoretical distribution type can be determined in the warehouse issue. According to a study by RWTH Aachen University, this applies to an average of 25% of all articles.
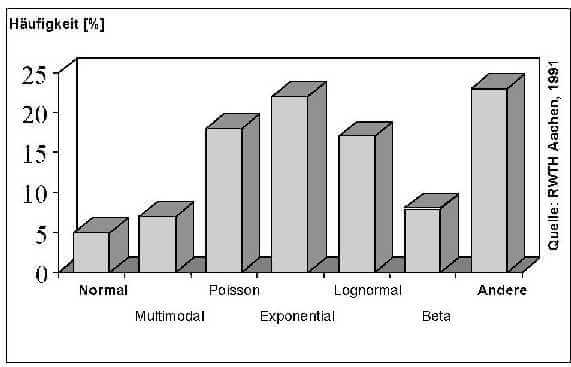
2nd study
Companies that do not use distribution-free processes therefore still have great potential for optimization. This was determined by Abels & Kemmner in an IT-supported study of 34 German series manufacturers and wholesalers.
Procedure
First of all, the items were ranked according to importance and predictability. The criteria used were, for example, the proportion of sales, the stock level, the service level, but also examinations of trends, seasonality and similar. This information was incorporated into an ABC-XYZ analysis and allowed the articles to be structured and grouped accordingly. Suitable replenishment strategies and the respective replenishment parameters were determined for each article group. The expected stock levels were then simulated.
Examination result
Abels & Kemmner identified a savings potential of at least 15% for 82% of the companies surveyed, and 32% could even save more than 25%. The largest cluster with 43% of companies can save between 20 and 25%.
Causes of the optimization potential
Companies rely too heavily on the existing parameter settings of the systems used, do not have the necessary know-how or simply do not have the time to introduce strategic optimization measures. As a result, great potential for improvement often simply remains unused. The Y2K problem has certainly contributed to this, as many new systems have been introduced that are still not optimized today. As it turns out, however, savings are being made in the wrong place.
The most common defects
The survey revealed the most frequent deficiencies in the following areas:
- Parameters preset by software houses were adopted without company-specific verification
- If parameter settings were made deliberately, they were based on data collected more than a year ago
- The calculation methods used were often not suitable for the stock issue behavior of the items concerned
- In some cases, only the simplest inventory planning procedures exist in the ERP systems Important uncertainty factors in material inventory planning (excess consumption, delivery delays or underdelivery) were not taken into account
By developing a company-specific scheduling strategy and setting the right parameters in ERP and PPS systems, it is possible to increase delivery readiness and ultimately sales, reduce costs and strengthen competitiveness. At the same time, market-oriented corrections can be made to streamline the product range to what is actually necessary.
3. problem solving in the Rudolph use case
In order to efficiently exploit the identified optimization potential, the specialist wholesaler for kitchen accessories Alfred Rudolph GmbH & Co. KG from Halver relies on the add-on tool for ERP and PPS systems DISKOVER (DISposition with the help of evidence areas, taking into account the actual stock issue distribution). With the help of Diskover, Rudolph doubled the turnover of his warehouse in just under two years. At the same time, the average delivery readiness level rose to 98.3%! In the first phase of the project, Diskover optimized the strategic scheduling parameters in offline mode. Diskover has been used as a front end for daily scheduling since the beginning of the year. For this purpose, Diskover was connected to the existing ERP system FAMAC via an SQL interface.
The problem situation
The range of items at Rudolph comprises approx. 15,000 items, of which approx. 7,000 are live items, i.e. items that have moved in the last twelve months. Approx. 5,000 items are always in stock. Around 2,000 orders with 4,500 items are processed every day. A new merchandise management system (FAMAC/AC-Service) was introduced in June 1998. Despite this new system, the stock level at the end of 1998 was just under DM 7 million, and delivery readiness fell below 80% at times.
The causes of this dilemma were quickly clarified by means of systematic analyses: On the one hand, the stock range only partially corresponded to market requirements, and on the other hand, the set disposition procedures and parameters had only been determined across the board and “by instinct”. There was a complete lack of assistance in optimizing the processes and parameters as well as options for determining trend and seasonal factors. This is where the strengths of DISKOVER 4.0 quickly became apparent. In 1999, due to a planned version change in the merchandise management system (MMS), the parameterization of the necessary scheduling parameters was first calculated externally by the consultants from Abels & Kemmner and then transferred to the MMS system. The advantage of this approach was that during this time the consultants’ know-how could also be incorporated into the optimization of the warehouse range and the employees received extensive training in the business background of modern scheduling procedures and analysis methods. DISKOVER 4.0 has been in operational use since January 2000 and, as the FAMAC front end, handles the entire scheduling process.
Daily scheduling with DISKOVER
Each of the four dispatchers can determine their daily workload using extensive selection options: For example, they can use the MRP controller indicator to select “their” articles and a supplier indicator to select specific suppliers that they want to process today. Using an event list, he can either display all articles for which DISKOVER has determined an order proposal, or he can initially select particularly critical cases, e.g. articles for which the safety stock level will be undershot during the replenishment period or for which shortages are likely to occur.
He can then view the current demand forecast and the order situation for each selected item. Using a seasonal/trend analysis, he can have seasonal and trend factors calculated and manually enter additional requirements for special promotions (large orders, sales promotions). Based on a dynamic, range-oriented order quantity calculation, DISKOVER then determines the necessary order proposals on a daily basis. The responsible dispatcher has the option of manually reprocessing these order proposals and then triggers order processing in FAMAC from DISKOVER. The orders determined in DISKOVER are then saved in FAMAC and managed for further processing.
Stock turnover almost doubled
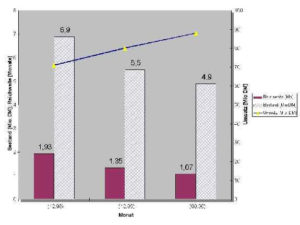
The success of using DISKOVER has now been fully confirmed (see Fig. 3). In 1999, inventories fell by around DM 1.5 million, despite a simultaneous increase in sales of more than 10%. Since the dispatchers themselves have been able to make full use of DISKOVER’s possibilities in their day-to-day business, the inventory situation and turnover have improved significantly once again. The inventory range as a ratio of inventory to consumption has therefore almost halved from 1.93 to 1.07 months. This corresponds to a virtual doubling of stock turnover.
4. working with DISKOVER
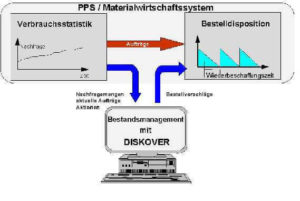
As an integrated operational system within an existing materials management or PPS system, DISKOVER receives the data through direct access to the database (with SQL-DB) of the corresponding host computer (see Fig. 4).
Required data input
Working with DISKOVER requires data that provides information about stock movements. The exact scope of the required data is agreed with the customer as part of the implementation project. Essential, relevant information for processing is included:
Stock issues: The amount of the issue and the corresponding time must be available for all items (either at individual document level or as cumulative monthly values).
Master data: For all items, the item-specific constant information must be included, such as item description, replenishment times, minimum order quantities, purchase prices, etc.
Article selection
Since in practice the articles of certain suppliers are assigned to the dispatcher or in the morning the articles with a current need for action due to falling below the safety stock or the occurrence of a shortage must be processed first, DISKOVER 4 supports the daily workflow with a high degree of freedom in the selection of articles.
| Free selection: Item selection criteria in Diskover |
| Dispatcher license plate |
| Supplier code |
| Matchcode |
| Free selection |
| Events |
| ABC indicator (sales significance) |
| XYZ indicator (demand behavior) |
| Dispotag |
For example, the MRP controller can compile all articles that are assigned to the MRP controller indicator “Müller”, are procured from the supplier “Schmitz” and are also AX or BX articles. The Events criterion also enables the selection of particularly critical articles. These are, for example, articles for which there is a shortage or the safety stock is not reached.
Forecast and planning module
Depending on the previously determined demand behavior (ABC/XYZ indicator), the forecasting and planning module offers the appropriate procedures for determining the basic requirement and the safety stock for the planned delivery readiness level. These include classic methods such as the arithmetic mean value, exponential smoothing 1. and 2nd order and also algorithms for determining trend and seasonal factors as part of the determination of basic requirements and, on the other hand, the distribution-free methods already mentioned above for determining basic requirements and safety stock.
The historical movement time series and the planned requirements of an item are displayed both in tabular and graphical form. To assess the planning quality, existing orders for the future are also transferred from the host system and displayed as a cumulative requirement quantity. It is also possible to supplement the forecast planned requirements by manually entering promotions (major projects, sales promotions).
Disposition
In MRP, order proposals are generated for each individual item, taking into account the set MRP procedures and the future requirements determined in the forecast. The functionality for determining the correct order time and the correct order quantity is provided by a dynamic, range-oriented order calculation. Minimum order quantities and order quantity increments (e.g. packaging unit) are automatically taken into account.
The time at which a new order proposal is triggered and the order quantity for the subsequent observation period are recalculated dynamically on a daily basis or with each calculation run. This functionality allows the MRP controller to follow the fluctuations in demand for an item much more precisely and adjust the order quantity accordingly.
The order proposals are then transferred to the host system and converted into purchase orders after being checked and approved by the dispatcher. In addition, various stock and range developments can be simulated by varying the parameters to be specified.
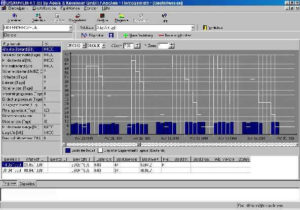
The requirements and the development of stock levels are displayed in a graph on a daily basis (see Fig. 5). The open orders and the newly determined order proposals are entered in a table. As long as they have not yet been converted into orders, order proposals can also be edited, deleted or supplemented with manually entered proposals by the dispatcher at any time.
Portfolio analysis/controlling
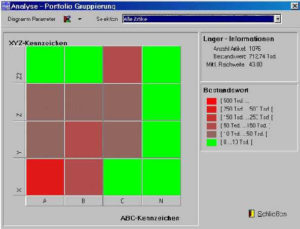
The portfolio analysis is a controlling function that enables the MRP controller to regularly examine his range of articles, e.g. with regard to stock levels and stock distribution. It is also possible to analyze sub-spectra by combining portfolio analysis with the item selection described above.
In the portfolio analysis, the selected items are displayed in a three-dimensional matrix structure. Two dimensions are displayed in the screen level, the third dimension is realized by color gradations of the fields. The three axes of this display can be optionally filled with the parameters stock value, range, replacement time, ABC and XYZ indicators. The following graphic (see Fig. 6) shows an example of an ABC/XYZ analysis with output of the stock values on the Z-axis (color coding).
For example, if you click on the matrix field for N-N items in the graphic, you can display the items that have not moved for at least 1 year but are still in stock (slow-moving items) and sub-select them for further root cause analysis.
Master data maintenance
DISKOVER offers extensive display and editing options for item master data and item-specific parameters in addition to the scope of services described. Which information is displayed in which order in an article table can be set individually. Other screens offer the option of editing master data fields and parameters for an individual item or for all items in the active item selection.
Helmut Abels is managing partner of the management consultancy Abels & Kemmner GmbH, Herzogenrath / Aachen. Dr. Abels is a proven expert in supply chain optimization, especially scheduling optimization and sales forecasting.
²Dipl.-Betrw. / B.A (Hons.) Andreas Gillessen specializes in supporting companies in the introduction of forecasting and controlling systems for sales planning and inventory optimization as well as business process optimization and is a partner of Abels & Kemmner.
Keywords
Sales forecasting, planning methods, convergence of planning methods and reality, IT tools
Summary
Precise sales forecasts are of great importance for corporate planning. But neither visions nor empirical planning methods alone will lead to optimized results. It is therefore necessary to synchronize the desired sales targets with the planning figures systematically. For this you will need sure instinct, expertise in applied methods as well as appropriate supportive tools.
Keywords
sales forecasts, demand planning methods, correspondence of material planning techniques with actual customer demand, data processing tools

