
Logistics specialist Würth optimizes its warehouse management
By Armin Breitner, Michael Mondelaers and Bernd Reineke
High delivery readiness often comes at the price of high inventories. That doesn’t have to be the case. At Würth Belux, stocks of pilot articles were reduced by 50 percent. Total inventory turnover was increased from 5.6 to 7.5 within a short period of time, which frees up liquidity. All this without any loss in delivery readiness of 98.5 percent and without additional costs for scheduling staff. This was made possible by the use of an optimization and scheduling tool.
New logistics destination
![]()
With its 330 companies in 80 countries, the globally active Würth Group trades in fastening and assembly materials. 2.65 million customers place their trust in Würth’s products and service. Thanks to its global logistics network, Würth stands for quality and perfect logistics. The latter is characterized by a delivery reliability of 98.5 percent and places the highest demands on employees, organization and systems.
However, the Würth Belux N.V. branch in Turnhout, Belgium, still had some homework to do to further optimize its procurement processes, as the Group management set a new logistics target of 9 stock turnovers per year for each country branch. However, stock turnover in Belgium was only 5.6 per year, a far cry from the target.
For this reason, the consulting firm Abels & Kemmner was commissioned to accelerate the stock turnover in order to achieve this new goal as quickly and efficiently as possible for almost 17,000 articles traded by Würth Belux.
The articles are primarily procured from the sister companies in Bratislava (SLO) and Landquart (CH) as well as from the parent company Adolf Würth GmbH & Co. KG (AWKG for short). While AWKG in Künzelsau already supplies the articles in small quantities in packaging units suitable for acceptance, the minimum order quantities at the sister companies are significantly higher. On the other hand, the articles of the Group’s sister companies are cheaper than the small quantities of AWKG, which should play a significant role in the later investigations.
Of a total of 17,000 items, around 13,500 are in stock and are sold from the inventory. The other items are procured on an order-related basis and are usually delivered directly from the supplier to the customer.
 Problem case IT

It quickly became clear that the goal could only be achieved with a corresponding change to the software-supported scheduling. Although the items in stock were planned and ordered by the buyers once or twice a week, the IT system only provided rudimentary support for the planners: although MRP lists with all the relevant information were issued, the buyers had to view them all and create the orders manually if necessary.
For items that are easy to plan, the existing system has also been expanded to include an automatic function with reorder point procedures and target ranges of coverage, but these do not take into account the individual consumption behavior of the items and can therefore only be set as a general rule.
There was therefore a clear need for action and the decision was made to use the DISKOVER optimization and scheduling tool, initially as a stand-alone optimization tool and now also integrated into the ERP landscape (in this case the Unix system MSP) for daily operations.
 Preparatory analyses

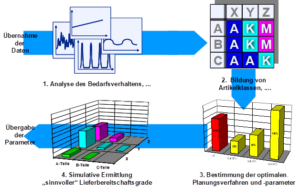
However, before the software could support operations, some preparatory analyses were required (Fig. 1):
ABC and XYZ analysis for structuring the range of articles (ABC analysis according to value-based sales, XYZ according to the article-specific coefficient of variation and the number of consumption periods, Z2 articles have no consumption in over 50 percent of the periods under consideration, N articles have no consumption in the period under consideration), trend and seasonal analysis, definition of stockpiling strategies and target delivery readiness levels, simulation of various scenarios with different logistical parameters.
The analyses were accompanied by optimizing measures to reduce logistical parameters such as replenishment time, minimum purchase quantities and batch sizes, which Purchasing was able to renegotiate with the suppliers.
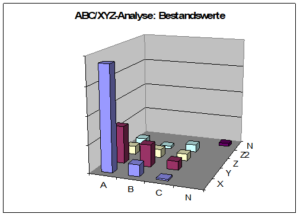
The evaluation of inventories as part of the ABC/XYZ analysis clearly shows that the purchasers understood very well how to hold inventories in the AB-XY range in order to achieve a high level of readiness to deliver for these items, to avoid taking a high risk due to regular consumption and to avoid inventories in the Z and Z2 ranges, which are difficult to plan (Fig. 2).
Further analysis showed that only an insignificant proportion of the articles (< 1 percent) had a trend character, but that five percent of the articles showed seasonal behavior that the buyers were aware of but had not previously been considered for automated replenishment.
Simulation and optimization runs
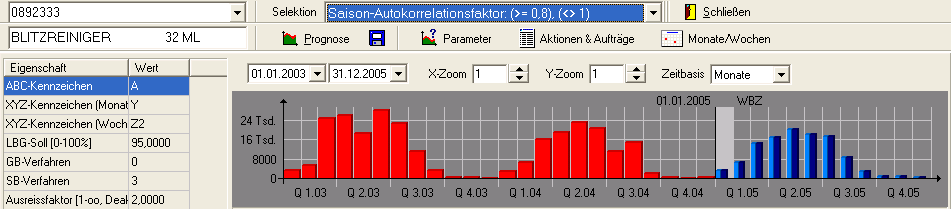
For the simulation and optimization runs, it is necessary to define the stocking strategies, which specify which items are to be stocked and which delivery readiness levels are targeted. As the order-related items were already excluded from the analyses in advance, all of the remaining 13,500 items must be in stock. Using the ABC/ XYZ matrix, the project team set the target delivery readiness levels (LBG target) with the aim of maintaining the very high value of 98.5 percent (Fig. 3).
The possibility of purchasing from different suppliers (sister companies, parent company, see above) played a key role in defining the simulation scenarios. Of particular interest was the question of how the price advantage of the sister companies (price-optimized scenarios) would affect the shorter delivery times and lower minimum order quantities of the parent company (turnover-optimized scenarios).
In the simulation runs, this was taken into account by the different logistical parameters such as delivery time, goods receipt processing time and minimum order quantities as well as the different purchase prices.
| Simulation scenarios | ||||||
| Parameters / Key figures | Is | I | II | III | IV | V |
| Goal | Optimum price | Optimum price | Optimum handling | Optimum price | Optimum handling | Optimum price |
| Outlier factor | – | – | – | 2 | – | 2 |
| EDZ | >>10 | 5 | 5 | 5 | 10 | 10 |
| LBG target | 98,5% | 98,5% | 98,5% | 98,5% | 98,5% | 98,5% |
Which scenario delivers the best results?
To assess the simulation results, the order volume and the number of order items over a comparative period were used in addition to the stock level and the degree of readiness to deliver. This is because the reduction in minimum order quantities and stocking periods inevitably results in more order items and therefore, of course, more goods receipt processes. The results are summarized in Figure 5.
When comparing the price-optimized and turnover-optimized scenarios, it quickly became clear that the 13 to 28 percent higher order volume compared to the actual situation exceeded the cost savings from the inventory reduction several times over and was therefore unacceptable. Similarly, the number of order items would more than triple in the scenarios with optimum turnover, thus significantly increasing the cost of purchasing and goods receipt. For this reason, only the price-optimal scenarios were considered below, all of which met the requirements for the degree of readiness to deliver.
In summary, it can be said that shorter cover periods lead to lower inventories, but drive up the number of order items. The outlier factor, which makes it possible to smooth out peaks in demand in the historical data, also has the effect of reducing inventories due to lower forecast values.
Overall, the price-optimized scenario V was selected, in which the target inventory value is 40 percent below the actual inventory value and thus an inventory turnover of 9.35 per year is achieved. The target of 9 transshipments per year set by the Group’s headquarters would thus be achieved.
The almost 250 percent increase in the number of order items can be absorbed by the purchasing department thanks to the automation options offered by the scheduling software. Assuming that all easily predictable X and Y articles can be ordered automatically in future, i.e. without the intervention of the buyer, the overall effort required to create orders can be reduced to below the current level. However, there will still be increased costs for incoming goods, which can still be managed by the logistics department to the extent calculated.
The software offers the following additional functions to further automate purchasing processes:
- Supplier-specific order and delivery days,
- Consideration of price/quantity scales,
- dynamic minimum ranges,
- Consideration of minimum order values,
- Consideration of packaging units in the safety stock definition,
- Exception notifications by e-mail to flexibly definable distribution lists.
Thanks to the flexible design of the DISKOVER interfaces to the higher-level ERP system, further requirements could be implemented in a short time, so that the solution is also well equipped for future requirements.
Results
The project results had a positive impact after just a short time. The results for the pilot articles planned with DISKOVER are more significant than for the conventionally procured articles, whose stocks also fell due to the reduction in minimum order quantities and delivery times: Over 50 percent stock reduction after five months.