
The prerequisite for getting a grip on stocks and delivery readiness
The market is picking up and delivery capacity is slipping! Is there a clear signal that sales forecasting is not working properly in many companies? Companies with a functioning sales forecast – we know quite a few of them and have helped many of them to achieve a reliable sales forecast ourselves – have reacted more quickly both to the onset of the recession and to the recovery of the market.
Despite everything, the importance of sales forecasting for a company’s success is underestimated by many: on the one hand, we come across companies that believe they are adequately positioned with their own know-how and existing ERP system and don’t even realize how bad they are because they have never been shown how good they could be. On the other hand, some companies believe that in the age of market-synchronized production, sales forecasting is no longer necessary and that poor delivery readiness or high inventories can be blamed on the inadequate performance of their planning. But how do you know how to set sail (= plan) if you don’t know which way the wind (= future requirements) is blowing?
How do you know how to adjust the sails if you don’t know which way the wind is blowing?
With the following 11 basic principles and best-practice building blocks for efficient and effective sales forecasting, we would like to clear up some misconceptions and point out the key success factors of a good sales forecast.
You will hardly be able to implement all best practice rules, either because you lack the tools or because the structure of your company or your product portfolio does not allow it. However, the more of these best practice rules are observed and implemented, the more efficient your sales forecast will be.
Basic principle 1: Forecasts at product group level are convenient for sales and useless for production and purchasing.
When sales forecasts are prepared by the sales department, this is usually done at product group level, i.e. for a condensed group of similar but not identical items. However, the purchasing department must order specific individual parts and production control must also create production orders for specific parts.
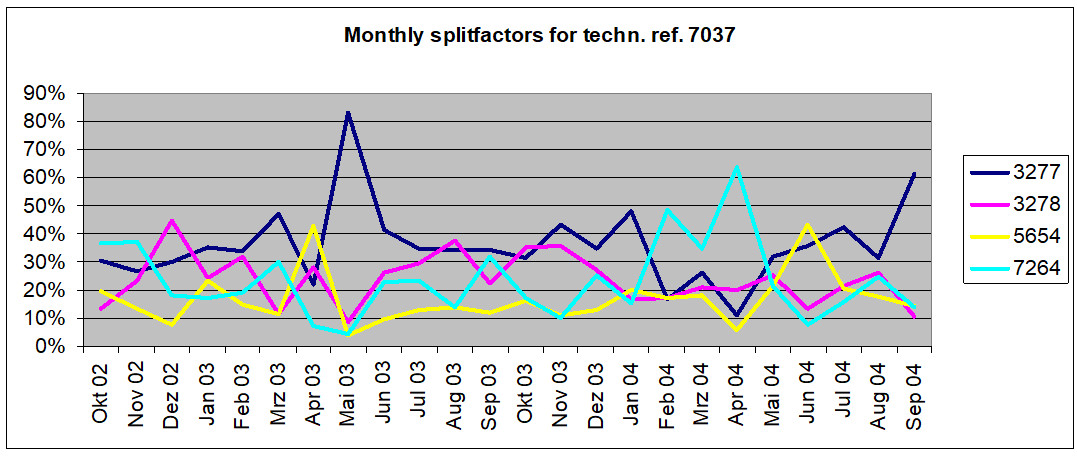
Split factors are often used to get from the general statement of the sales department to the individual material numbers. The forecast demand for a product group, e.g. the TV sets product group, is therefore broken down into the demand for the individual appliances: HD-TS 15 appliances account for 22% of demand on average, HD-TS 16 appliances account for 8%, and so on. If you work with split factors, have you ever calculated the monthly fluctuation of the split factors? Probably not, otherwise you would no longer work with split factors…
Splitting factors almost always fluctuate so much that they are completely useless for drawing conclusions about the requirements of an individual material number from a material group forecast. In technical jargon, this is known as the “split factor problem”(Fig. 1).
If you need information about the future requirements of specific articles, material numbers, SKUs (Stock Keeping Units), stock items, etc., you cannot avoid an article-specific forecast.
Your best practice building block 1 is therefore: Forecast at individual part level / SKU level and avoid split factors .
Basic principle 2: The sales department is completely overwhelmed with a forecast at item/material number level.
This sounds banal at first and is one reason why the sales department usually submits its sales forecasts at a summarized level, e.g. a product group level.
However, the sales department is not only overwhelmed in terms of quantity when it has to deal with thousands of material numbers, but also in terms of quality. Anyone who has never worked in sales can hardly imagine how difficult it is to develop an accurate sense of how demand for an individual item will change in the future. You may have a reliable feeling as to whether demand will rise, remain the same or fall for a group of similar items, but not for an individual item.
In addition, sales employees usually have to think on two levels: On the one hand, they have a certain demand expectation and, on the other, a sales target that often has little to do with their own demand expectation. Which future sales volumes for the next few months should a sales employee include in her forecast? Those that she expects based on her experience or those that are expected “from above”?
Ultimately, we all – including sales staff – tend to let our expectations regarding the future be influenced by recent experiences. In technical jargon, this is known as “recent past bias“.
We have no choice but to reduce the influence of the human factor when it comes to objectively forecasting future sales volumes of articles.
This brings us to your best practice building block 2: For most industries and in most markets: Sales forecasts must be prepared in the form of technical (=statistical) forecasts. Information should only be requested from the sales department where technical forecasts are inadequate.
Sales can only ever create forecasts for sales items, be they standard products or spare parts. He cannot make any meaningful statements about individual assemblies or individual parts, which he never sells in isolation. This is another reason why it is not always possible to rely on sales forecasts, because…
Basic principle 3: The finished goods level is not always the correct forecast level
We often hear from companies that it is not possible for them to make a correct sales forecast because the number of variants of their end products is too large or practically every end product is customer-specific. It is typical of such companies that they build their end products from standardized or partially standardized assemblies and components and that only some of the components are truly customer-specific.
The customer-specific solution therefore results from the variable arrangement of the “Lego bricks” and not from individual building blocks. In most cases, the delivery times accepted by the market are at best sufficient to build a customized solution largely from standard components. The “logistical decoupling point”, i.e. the point in the value stream from which production can be based on customer orders, is usually before final assembly; sometimes even further up the value stream.
Until the logistical decoupling point, production must be anonymous to the customer and therefore stocked. This is precisely the point in the value stream where a sales forecast must start.
And so the best practice building block 3 is: The warehouse level at which forecasting should take place is at the logistical decoupling point, i.e. at the last customer-anonymous production stage .
The above three basic principles should have made it clear that technical forecasting is of considerable importance in the sales forecasting process. In practice, however, technical sales forecasts are handled so carelessly and sometimes ignorantly that it is not surprising that many companies do not trust statistical forecasts. Statistical forecasts are sometimes wrong, but on average they are usually better than human forecasters, especially as they can usually only deal with a few selected articles at all and have to deal with the rest of the articles in a rather generalized way due to their sheer number.
Statistical forecasts are sometimes wrong, but on average they are usually better than human forecasters, provided that the statistical forecasts are worked out correctly
However, the prerequisite for this is that you set up your statistical forecasts correctly. In the following, we will therefore look at important basic principles and best practice rules for effective technical forecasts. Some of these best-practice rules represent organizational requirements for your forecasting process and some of them must be implemented on the software side
Basic principle 4: Each sales forecast consists of three details and not just one forecast value
We know the situation from the weather forecast: Saturday should be mostly sunny with temperatures around 21°C. On Saturday evening at 8pm we stood with freezing guests in 18°C drizzly weather and struggled with the damp charcoal. The obvious accusation is probably that the weather forecast was wrong. If we hadn’t had the weather forecast given to us by the weather fairy on TV, but had checked the weather service on the Internet, we might have found out that there was a 45% chance of rain on Saturday evening and that the temperature would be 22°C, with a 25% chance that the temperature would fluctuate within +/-1° and a 67% chance that the temperature would fluctuate within +/-3.75°. Drizzly weather and 18°C were therefore well within the range of the forecast.
We have two main problems with forecasts, regardless of whether they concern the weather or the future demand for items: firstly, we have no sense of probability and, secondly, we like to pick out what we want to hear from the information provided. The TV weather report therefore capitulated straight away and dropped the probability of rain and the range of temperature fluctuations.
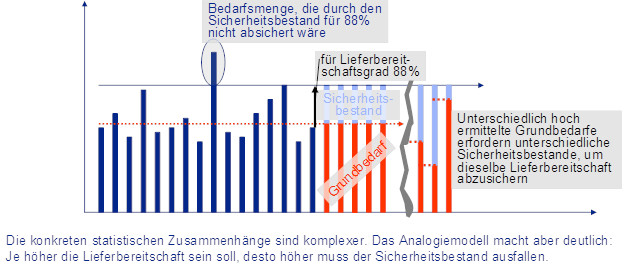
It is important to understand that a forecast not only consists of forecast values, for example the expected monthly consumption in the coming months, but must also contain a statement about the uncertainty of this forecast. Instead of forecast values, it is therefore more correct to speak of basic requirements. The uncertainties in the forecast must then be covered by safety stocks. How high the safety stock must be depends on the statistical certainty with which you want to be able to deliver. The higher the required delivery readiness, the higher the required safety stock (see Fig. 2).
Best practice building block 4 is therefore: A sales forecast is only complete if it contains information on basic requirements, safety stock and the required delivery readiness.
Basic principle 5: The demand for items is almost never “normally distributed”
Perhaps you still remember the normal distribution or Gaussian bell curve that you once heard about at school. First of all, the normal distribution states that measured values fluctuate symmetrically around a mean value towards smaller and larger values. The fluctuation range is subject to certain regularities; for example, 68.27% of all values lie around the mean value with a fluctuation range of one standard deviation.
You do not need to understand the normal distribution statistically; however, you do need to know that all classic forecasting methods, such as the moving average or exponential smoothing of the first or second order, only determine statistically correct basic requirements for items if the demand for these items is normally distributed, which in practice only applies to around one in 20 items (cf. Fig. 3). Around 95% of your demand forecasts are therefore systematically and systematically wrong.
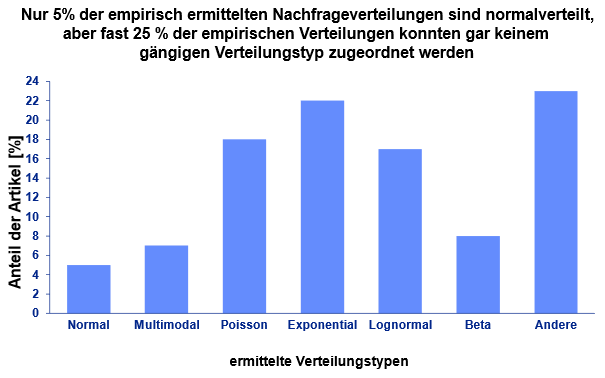
Figure 3: Most items do not have “normally distributed” demand
Of course, there are also forecast formulas and safety stock procedures for other forms of demand distribution. In practice, however, it is not possible to do anything with it: The demand distribution, i.e. the regularity according to which the demand for an item fluctuates, can change from month to month and for a good fifth of all items, no demand distribution can be identified at all.
There are three approaches to dealing with this problem: The most common solution is to ignore the problem. This is the typical solution approach of most ERP systems.
Around 95% of your demand forecasts are systematically and systematically wrong.
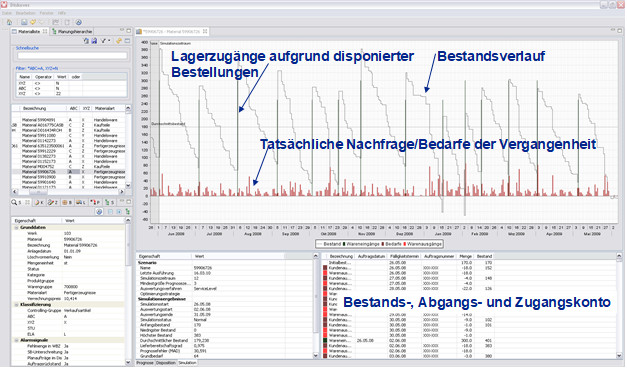
Reliable forecasts can only be achieved if, for each forecast run for each item, you check which of the various basic requirements and safety stock calculation methods would have achieved the best results in the past when forecasting for a particular item, in order to then apply this combination of basic requirements and safety stock calculation methods to the forecast of future sales volumes. This approach requires the simulation of the determination of basic requirements and safety stock and the resulting planning depending on the actual demand over a certain period of time – preferably one year – in the past (see Fig. 4). This approach does not avoid the problem that the forecasting methods are not correct from a statistical point of view, but at least the basic requirements and safety stock method that has achieved the best results in the past is selected from the group of “incorrect” methods on an item-specific basis.
This procedure is time-consuming, as a large number of simulations with different basic requirements and safety stock calculation methods have to be carried out for each forecast. This would bring an ERP system to its knees. Such calculations must therefore be carried out outside the host system in special subsystems.
A third approach is the use of so-called “distribution-free” methods. These are basic requirements and safety stock calculation methods that work without knowledge of the actual demand distribution, and are therefore mathematically and statistically correct and thus lead to the desired supply readiness. These distribution-free methods can only be found in very few sales forecasting systems.
This brings us to Best Practice Module 5: In order to calculate reliable sales forecasts, you need to simulate the most suitable basic requirements and safety stock calculation methods for each item every month in order to calculate the forecast for the next requirements. Use a large number of different basic requirements and safety stock calculation methods. Also use distribution-free methods. However, instead of working only with distribution-free methods, integrate the distribution-free methods into the simulation runs.
Basic principle 6: The quality of the sales forecast depends on the quality of the demand time series from the past.
When you create a statistical sales forecast, you try to make statements about future requirements from a past demand time series. It is obvious that the more accurately the historical time series reflects the actual market requirements of the past, the better the quality of the forecast. If you only use the stock issues as a historical time series, it can happen that there are gaps in the time series in which you were not able to deliver and during which, logically, no stock issue could take place. If you use this time series unchanged as the basis for your forecast, then you assume that the lack of stock outflows was due to a lack of market demand. You have already distorted the truth.
Your forecast will be a little better if you use the time series of agreed delivery dates and delivery quantities, but even these can still have delivery gaps that have nothing to do with demand gaps.
You can go even further by accessing the time series of customer request quantities and dates. This means that you are close to the customer’s wishes and therefore close to market requirements. If you were unable to deliver, informed the customer of this and they therefore did not place an order, then the market demand is not fully documented in the time series of customer request quantities and dates. For this reason, you would normally also have to record zero sales, i.e. inquiries that did not result in an order, if the order did not materialize due to a lack of availability and not because of the price.
Best practice building block 6 is therefore: If possible, use customer request dates and quantities at finished goods level as a history of market demand and record zero sales due to a poor delivery situation. If you are forecasting at component or individual part level, you derive “corrected” requirements from the historical time series of finished goods.
Even if your forecast is now based on the correct demand history, you have not yet reached the end of your work. Are you involved in promotions or project business? Basic principle 7 must then be observed.
Basic principle 7: In addition to general demand, historical time series usually also include promotions and project business, which are difficult to forecast together.
In general, three forms of demand can be distinguished. On the one hand, there are “actions” in many industries that are carried out by the sales department or have to be carried out due to customer requirements. In such promotions, either a certain product is only offered for a short time or a product that is sold on an ongoing basis is temporarily offered at a lower price. This type of action typically occurs in the retail sector. In the first case, a distinction can be made between goods that are only offered once and those that are offered repeatedly. In the first case there is no past time series from the last action(s), in the second case there is an action-specific past time series.
If a product that is sold on an ongoing basis is used in promotions, the requirements history inevitably contains requirements from promotion phases and requirements from non-promotion phases. In general, a company, or rather the sales department, should be able to plan promotions in good time so that action requirements can be scheduled in good time; although admittedly the problem of determining the right quantities of promotions remains. As mentioned, it often helps to look at past campaigns.
In order to create a forecast for the current, non-action demand, the actions must be removed from the demand history if they stand out from the background noise in terms of their size. This can be done manually for a few items, but not for a large number of items. Automatic mechanisms are needed here to separate the need for action from the background noise.
Projects are shown separately from actions. Projects exist where larger quantities of one or more items are sold to individual customers and these quantities are explicitly negotiated with the customer. Typically, you are in competition with other “market competitors” for projects. Projects are often decided at short notice after a long lead time and products often have to be delivered at short notice. Projects must also be automatically filtered out of the item’s requirements history using suitable filter mechanisms if they are substantially outside the background noise. If this is the case, the sales department is required to provide estimates when forecasting projects, despite all the imponderables.
The actions and projects to be filtered out become noticeable through “peaks”, i.e. short-term peaks in demand, and can in principle be identified and eliminated using so-called outlier elimination procedures. The challenge lies firstly in good procedures and secondly in setting the filter correctly. This can only be achieved reliably through simulations of forecasting and scheduling behavior, in which different levels of selectivity are regularly checked on an item-specific basis using daily historical requirements time series and the most suitable one is determined.
Best practice building block 7 is therefore: Project business and actions that are substantially outside the background noise must be separated from it and forecast separately. The correct selectivity for automatically filtering out projects and actions from the background noise must be regularly determined on an item-specific basis using simulations.
Basic principle 8: Demand for the same item develops differently in different sales channels / sales regions.
It is a triviality that an article sold to several key accounts or in different regions is not in demand to the same extent in all sales channels. In France, for example, demand is very steady but at a low level, while in Poland, purchases are sometimes larger and sometimes smaller and very irregular. If both countries are supplied from one production, one might think that it is sufficient to forecast the total demand for this article in order to keep the stocks in the central warehouse sufficiently high. This would possibly lead to the French and Polish distributors being required to provide a forecast for this article. By separating into two sales channels, it is no longer necessary for French sales to provide forecasts for this item, as a technical forecast can provide sufficiently accurate and objective figures. If the national distributors have their own regional warehouses, separating the forecasts into the various distribution channels offers the advantage for logistics that it becomes clear which replenishment quantities need to be delivered to the local warehouses of the individual national distributors and which safety stocks need to be held there.
Best Practice Module 8 therefore calls for forecasts to be broken down by sales channel / region.
Do you supply your customers via several distribution levels, for example from a central warehouse to various regional warehouses or national distribution warehouses? Then there is another basic principle to consider:
Basic principle 9: The real market demand in a supply chain is the demand of the end consumer
Whenever you deliver your finished goods to end consumers via several intermediate storage stages, the question arises as to who your customer is. Is it the national company or the end consumer in a specific country? A country or regional warehouse can turn a steady demand from the end consumer into an irregular or intermittent demand at the central warehouse, as the country or regional warehouse collects requirements and then passes them on intermittently. From the point of view of transportation costs, it may or may not be cheaper to proceed in this way. For the sales forecast, this means in any case that higher safety stocks have to be held and the actual market demand is distorted. If you consider the national company as your customer, you must forecast the demand of the national company, based on its possible stochastic demand in the past, so that you can ensure sufficient supply capability for it.
However, by considering the national company and not the end consumer as your customer, you are already deviating from the overarching optimization of your supply chain and pursuing segment optimization with the consequence of a poorer forecast and higher inventories in the supply chain. If your customer is an external third party, for example a DIY store or a general agent in a country where you are not represented by your own sales company, you will probably have no choice but to regard them as your customer, even though they are actually only an intermediary; segment optimization remains the case nonetheless.
However, if the “middleman” is part of your own company, for example in the form of a national sales company, you should consider whether it would be better to base your forecasts on end consumer requirements (point-of-sale requirements) in order to optimize your supply chain as a whole. The historical demand time series of the point-of-sale requirements of different regional or national warehouses can be consolidated at different distribution levels. You can use this data not only to create forecasts at regional or national warehouse level. Instead, you can also summarize the requirements at central warehouse level and forecast basic requirements and safety stocks there – upstream in the value stream. In doing so, you are probably taking away some of the “middleman’s” authority.
Best practice module 9: To optimize the entire supply chain, you need to create the necessary forecasts for different distribution levels based on end consumer requirements and not on the requirements (call-offs) of intermediaries. This applies all the more if the intermediaries belong to the company’s own group.
Basic principle 10: Predecessor articles and similar articles exist for many new articles
It is routine for practically every company to regularly launch new products on the market. Each time you are faced with the problem of forecasting the expected demand for this item.
If a successor article is merely a technical update of the predecessor article, it is usually sufficient to transfer the requirements history of the predecessor article to the successor article by means of a predecessor-successor relationship.
As soon as a successor product has technical compromises or design changes compared to the predecessor product, it becomes more complicated to quantify the future demand for the new product. Nevertheless, even in such cases, transferring the development of demand from a suitable predecessor article or representative article remains a helpful approach.
A successor article does not always simply replace a predecessor article. A predecessor item often expires while the successor item is already being phased in. In such cases, a pure predecessor-successor relationship is not sufficient to create a sales forecast for the two articles. In addition to the predecessor-successor relationship, an overlap period must be defined and consideration must be given to how the “substitution curve” runs over this overlap period.
If a new item expands the existing product range, it is to be expected that the new item will attract some of the market demand for the items already on offer. This is referred to as cannibalization of demand for existing articles. This must also be taken into account in an efficient sales forecast. And even in this case, you may have to bear in mind that the cannibalization effect builds up over a certain period of time.
Predecessor-successor relationships, such as substitution relationships, “grow out”, because after some time a sufficiently long history of demand for the “new” item is built up.
Best practice module 10: Document predecessor-successor and substitution relationships to forecast the development of demand for new items and the cannibalization of demand for continuing similar items.
Basic principle 11: Some forecasting situations defy traditional approaches
We are all familiar with these exotic items, where sporadic market demand hits us by chance. A typical example of this group of articles is spare parts. It seems to be a basic characteristic of spare parts that customers always ask for a part that has not been needed for months or years just after it has been scrapped.
Even more exotic are end-of-life forecasts, such as those you have to create in the electronics industry, for example, when important components that are either expensive or cannot be replaced by other parts are discontinued by the supplier while your items still have to be manufactured or at least maintained for some time.
Think of the fashion industry, which is regularly called upon to determine the quantities required for new collection items.
In such cases, it sometimes helps to develop a specific forecasting method, as we did for the end-of-life forecast of components for Medion, for example. With the help of a special forecasting exchange, hsx.com, a company in Los Angeles, is reportedly able to make very good forecasts for the box office takings of new feature films.
If it is not possible to get the forecast under control, sales are either lost due to a lack of delivery readiness or high costs are incurred due to excess stock and scrapping. The only way to reduce these costs is to intelligently align the corporate business model with the limits of the logistics business model.
In this way, the supposed operational problem of a poor sales forecast can become a strategic challenge for the company.
Best practice module 11: Special situations may require special forecasting methods. If this is not successful or the consequences are too expensive, the only option is to intelligently align the corporate business model with the limits of the logistics business model.
The deeper you go into the details of sales forecasting, the more best practice rules can be established. Not every best practice rule can be followed in every case, especially if you are trying to make progress with on-board resources.
Don’t be put off by the supposed complexity of these rules. Many of the best practice building blocks listed are practically self-fulfilling if you create your forecasts with a powerful sales forecasting system and configure it correctly. This will not only enable you to take a big step towards a best practice solution, but also to achieve less complex sales forecasting processes.
In conclusion, however, it should be noted that anyone who shoots with a home-made rifle and a bent barrel should not be surprised if the rifle misses. One can only wonder if the hobbyists conclude from this that even professionally manufactured rifles fundamentally miss.