
No effective logistics controlling without reliable key figures!
Key figures help to assess processes in logistics and supply chain management. However, the reliability and resilience of the figures is crucial.
When we talk about logistics controlling in companies, the question very quickly arises as to which key figures are required. Many interviewees then proudly point to the large number of key figures that their “business intelligence systems” provide them with.
However, people’s knowledge does not increase in proportion to the amount of information available. It all depends on the right information. It is therefore worth discussing which key figures actually help to assess the performance of logistics and supply chain management and what problems can arise when determining them.
Data transparency
The question of the transparency of the key figures is particularly important. Why don’t you do your own personal key performance indicator rodeo and check whether you are on the right track? Make a note of your three most important key figures in logistics and write down – as a sort of calculation guide – how they are calculated! If you have not yet been thrown out of the saddle, try to reproduce the key figures in a spreadsheet program using exemplary input data. If you are still holding the reins of your key figures: Great! You have probably tamed the issue of data transparency.
But you are probably like most people: You constantly apply key figures and draw your conclusions from them without understanding exactly how the key figures are formed. The harmless logistics indicator of inventory turnover is probably sufficient as an example. Do you relate the inventory to sales at sales prices or to sales at production costs? Both approaches are common. However, the two figures for stock turnover can differ by 30%. Do you take gross sales, or have you deducted returns? Depending on the industry, there can be a difference of 30% between these two values!
As you can see, in order to draw the right conclusions from a key figure, you need to know how it is formed. You don’t just have to know the formula. You also need to understand which input data was used and which error corrections were made or not made. It is also necessary to know in which stages the input data was calculated in the first place. The average of the total inventories of three divisions, for example, does not correspond to the sum of the average inventories of the three divisions, although the term “average inventory” is used in both cases. In the second case, however, the average stock was calculated incorrectly…
Be honest: Do you know the input values, error corrections, formulas and calculation methods for all the key figures in your data warehouse? And would you even be able to obtain this information with reasonable effort?
Realistic limit and target values
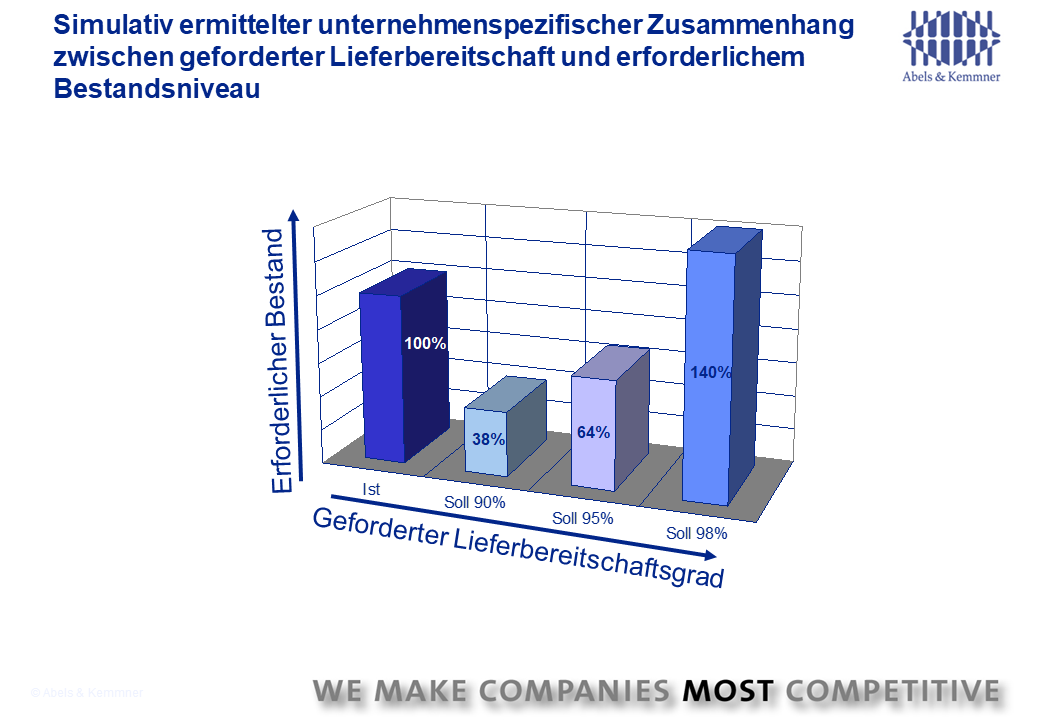
For most key figures in logistics, we not only measure the actual value, but also like to set targets. These must then either be achieved or exceeded or undercut. But where do these target values come from? Are they even realistic and achievable? In our experience, the values are often set quite arbitrarily or from a blinkered perspective. On the one hand, you will find inventory targets that have been set and, at the same time, delivery readiness levels to be achieved that do not match the inventory targets at all. No matter how you jump, you always have to break one of the two bars to be able to jump over the other.
However, this blinkered perspective when setting targets is not limited to the field of logistics. The extent to which this blinkered perspective is widespread is demonstrated to us on a daily basis at company level. And the effects are serious: purchasing should reduce procurement costs in relation to sales, production should utilize capacity, logistics should reduce inventories and sales should increase sales (usually not earnings!). In order to get your own ball into the goal, you constantly have to straddle your colleagues’ legs. To believe that the collision of all leads to the overall optimum is naive, to say the least.
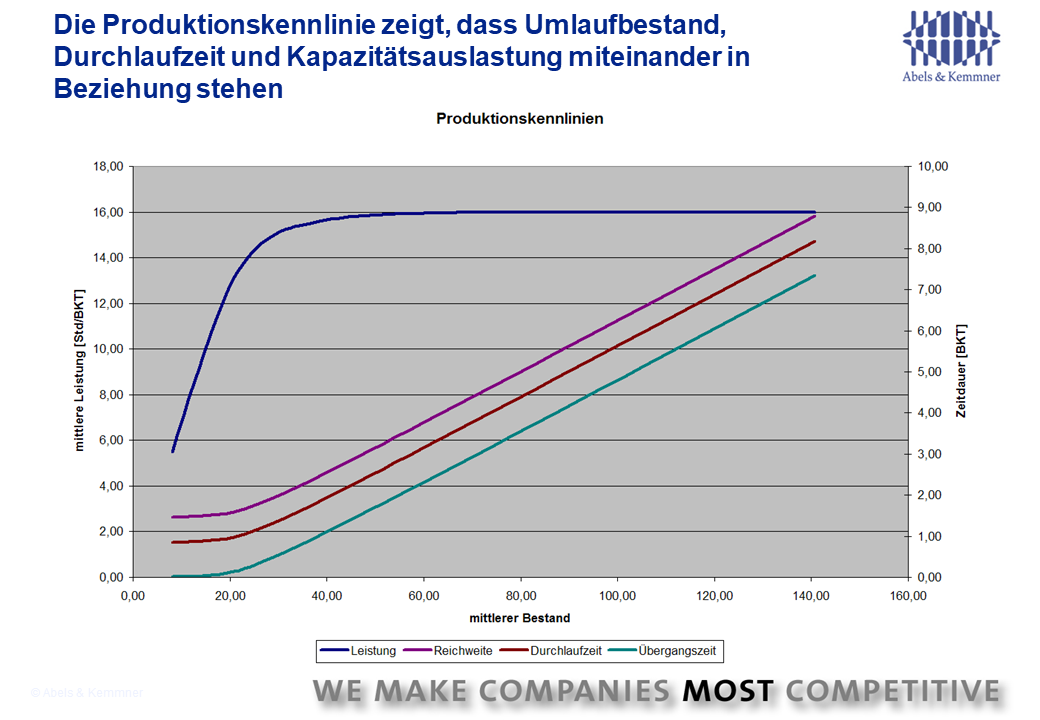
Most key figures, not just the logistical ones, are interrelated via the underlying relationships they describe. Physical and economic factors therefore often block the path from the actual values to the target values. You can’t move mountains with exaggerated target values alone. Especially not when different areas of the company want to move the mountain in different directions. Target values for logistical key figures can therefore not be set independently of each other, but must be balanced. However, most companies lack suitable tools for this. However, it is essential to build up such a set of tools in order to increase the efficiency and thus the profitability of a company in a targeted manner through key figure controlling.
Realistic limit and target values for logistics KPIs can only be determined if the potential of the underlying logistics and value chain is known. This is then used to forge an integrated and corresponding set of limit and target values for the various logistics KPIs, which is regularly adapted to the changing boundary conditions. It is therefore about the overall optimum and not the sum of partial optima.
Which instruments can be used to achieve realistic target and limit values for logistical key figures in order to achieve an overall optimum? Many companies like to use value stream analysis for this purpose. The value stream considerations are indeed very helpful in analyzing the fundamental logistical relationships. However, in order to derive realistic target values for future logistics performance, it is only suitable for you if your products are in demand on the market in as equal quantities as possible per month and are subject to minor fluctuations. In other cases – i.e. almost always – you are wrong with the static approach of value stream mapping.
A simple example makes this clear: What use is a target of one day throughput time in a production area whose average production capacity utilization is 4,000 hours per day according to the value stream analysis and which has a capacity of 5,000 hours per day if the actual capacity load fluctuates between 12,000 and 2,000 hours per day? On average, you achieve the target value of one day throughput time. At peak times, however, the throughput time is extended to 12 days and possibly more. If you have also taken a small amount of required safety stock from the value stream analysis, as the warehouse behind this production area can be restocked within one day, then this warehouse behind the production area will run dry again and again if you cannot meet the short lead time.
If you design the key figures “cleverly”, you may even achieve the lead time and inventory level targets; nevertheless, the physical facts that ultimately result in the total costs are different. These key figures therefore do not reflect reality. If you miss the target symmetrically on the left and right, then statistically you will always hit the bullseye, although you will never actually reach the target. We therefore always warn companies against naively applying value stream mapping to arrive at target values that cannot be achieved in practice or that do not capture the real logistical situation.

With the usual fluctuations in demand on the market in today’s economic situation, you can only achieve realistically determined logistical improvement potentials and thus realistic target values through a dynamic simulation of the logistical value stream behavior over time!
Bringing causation and responsibility together
Achievable and coordinated target values are an important prerequisite for people and areas to achieve an overall optimum, i.e. the most efficient logistics and value chain possible. However, this only works if the people and areas concerned can also influence the key figures by which they are measured. That makes sense, you will say! Why then, I ask, are the responsibilities for key figures always distributed so illogically? Supply chain management is measured by inventories, although a considerable proportion of inventories are caused by product management or marketing in the form of unsaleable “world bestsellers”. Production is measured by capacity utilization, although this depends on market demand and the willingness to pre-produce “in stock” in the absence of demand. Sales are measured by turnover and therefore exploit every product variant, no matter how exotic, even though this brings profits to their knees.
This does not lead to a corporate target system, but to collective irresponsibility. If logistics is responsible for the fishing rods that the sales department puts in the water, but the fish caught go to the sales department, then even the smallest and crookedest fishing rod is thrown into the water to catch one more poor little fish.
Unfortunately, in practice, several areas usually have an influence on a particular key figure. To hold only one area responsible for this if it has no authority to issue instructions to the other parties responsible falls short of the mark. However, the obvious solution of making several functions in the company jointly responsible for a key figure would also fall short. Experience shows that either someone is responsible or no one feels responsible. Experience has shown that the failure of two areas, for example logistics and sales, to achieve an inventory size for which they are jointly responsible no longer causes too much pain in either area. Unmet incentive targets may still hurt, but the broad mantle of shared responsibility blurs the contours of responsibility.
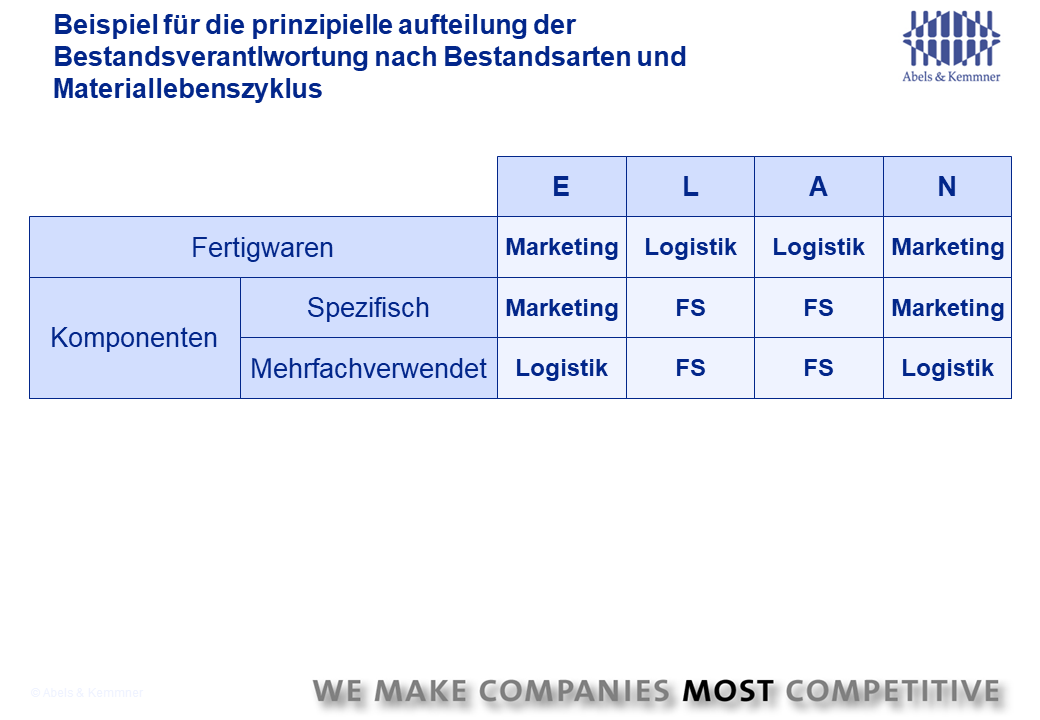
Things get crisper when key figures are broken down and assigned to the respective main contributors. For example, launch stocks can be the responsibility of product management and marketing, stocks for live items are the responsibility of materials management and, in the case of discontinued items, stock or scrapping responsibility is returned to product management after an item has been externally discontinued. Only by assigning responsibility in this way can we move from collective irresponsibility to responsible action.
Enable flexible evaluations
Regardless of whether you operate with just a few logistics KPIs or whether you track many KPIs: You will always find yourself in a situation where you spontaneously and temporarily need specific key figures and evaluations. Even the most comprehensive system of key figures will not save you from this situation. If you have a spontaneous need for information, want to clarify questions in detail and want to get to the bottom of the causes of changes in key figures, then you must have the possibilities, means and rights to carry out data analyses.
However, the availability of a “Business Intelligence” system alone does not enable you to carry out ad hoc analyses. With some of the systems available on the market, you first need a few days of training or a competent IT supervisor to be able to carry out data analyses independently. If you then have to carry out analyses yourself a few weeks later, you have already half forgotten how to use the system. All too often, even with such ad hoc evaluations, it is not really clear how the basic data used was prepared beforehand, which errors were eliminated and which may still be dormant in the basic data.
And here we are faced with another problem: in some companies, the issue of data security is pursued with such vehemence that even employees in the IT department are not authorized to read important data tables in an IT system, even though no personal data is involved. Flexible, situation-dependent data evaluations are therefore only possible with so much effort and immense authorization bureaucracy that hardly any employees are willing to run the gauntlet and the associated effort. It seems as if these companies consider the importance of logistics data to be so crucial to their own competitive success that they secure it like gold in Fort Knox. But what good is gold in a database if you can’t access this data? No treasure can be salvaged like this!
Ensure data quality
The meticulousness with which the company’s golden database is monitored is sometimes in stark contrast to the quality of the data used. Even with the simplest data evaluations, we regularly come across significant errors in the master, movement and control data (forecast, planning, control parameters, etc.) in our projects, which we first have to correct, at least approximately, in order to be able to continue working with the data.
There is actually nothing that does not exist: Missing or flat-rate replenishment times for articles, articles without prices, lots of production orders that were started in the last millennium and have not yet been completed (or confirmed). Our challenge cup for the most original data error was held for some time by a company that meticulously calculates reorder points but plans all items according to schedule. It is currently owned by a company that manages to calculate economical batch sizes without having to factor in storage costs and fixed order costs. To get your hands on this challenge cup, you have to come up with something more special than negative stocks or negative prices.
Why are such mistakes not noticed in day-to-day business? This is largely because the users do not have the time to maintain the data, they lack the knowledge of how to set the data correctly or they are not even aware of the significance of a data value for the correct automation of a process.
The number of item-specific data values to be maintained in an ERP system is sometimes so large, depending on the functional and performance scope of an ERP system, that the annual working time of the user would not be sufficient to call up and view each data value at least once a year. In an SAP core system, up to 130 pieces of data must be maintained for each material number. With 20,000 material numbers, that makes 2.6 million data fields that would have to be checked at least quarterly. Data quality also has something to do with a certain carelessness in handling the data in the ERP system, but even with the best of intentions, sufficient data quality can hardly be ensured without the appropriate tools. So is the cat biting its own tail? Is there any way out of this dilemma?
A software-supported system for monitoring and maintaining data quality is very important, indeed practically indispensable, in order to provide sufficiently clean basic data for a logistics KPI system.
Incorrect master and transaction data, often kneaded through, calculated in several stages, divided into individual key figure packages and provided via a business intelligence system, sometimes have the character and harbor a similar danger to the fragmented certificates that promised unlimited prosperity and propped up the entire global economy in the crisis. However, we should at least take countermeasures in our logistics KPI systems before it is too late. Our consultants will be happy to support you!