
By Götz-Andreas Kemmner
In the last issue of POTENZIALE, we presented the first three best-practice building blocks for a logistics controlling system that lives up to its name. You have learned that you cannot measure anything meaningfully if you have not defined it concretely, which in many cases first requires the development of a logistics strategy. However, measurement alone cannot be the goal, it is a means to an end – and the end should be the improvement of logistics. But in order to improve something, you first have to understand it: So you can’t expect the accounting department to single-handedly define meaningful key figures for logistics controlling! This is where logistics specialists and merchants must work together with the aim of initiating a permanent improvement process based on jointly defined key figures.
And here we have already arrived at the next principle, which sounds more trivial than it actually is: Basic principle 4: Key figures that are intended to help with improvement processes must also accurately describe the situation.
Good logistics controlling does not only pay attention to key figures, but without key figures no controlling works, not even logistics controlling. For this reason, we need to take a closer look at the requirements for these key figures below.
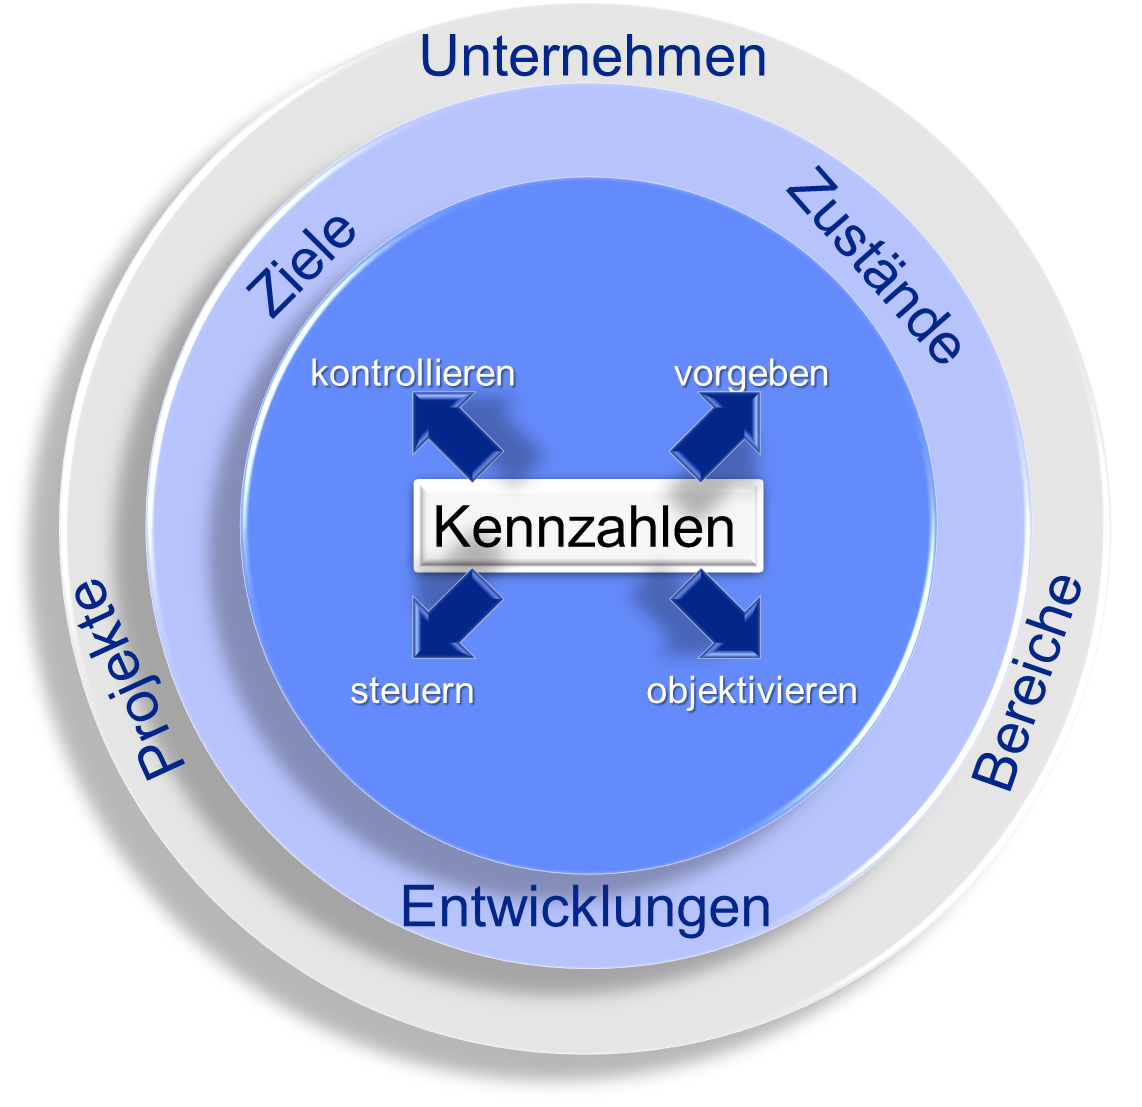
Effective controlling also requires effective key figures. If key figures do not quantitatively describe the goal you want to achieve – in technical jargon this is referred to as “operationalizing” – it is already foreseeable that you will not achieve your goal. An old controller rule says: “Be careful what key figures you give your employees, they could use them as a guide!” This is based on the experience that people sometimes work towards a goal with blinkers on, so that a target value is achieved but the actual idea behind the goal is missed.
Key figures only capture a target correctly if they capture it “completely”. To this end, they must be structured in such a way that they cover the states to be monitored and the targets to be achieved as completely as possible and do not focus on just one aspect.
Key figures are “complete” if they
- are compiled in a targeted manner and not gathered through diligent collecting and hunting.
- pick up the various opposing effects on the way to a target.
- if they measure not only the goal in the wording, but the higher purpose of the goal.
“It would be interesting to know” does not lead to a targeted compilation of key figures, but is at best a motive for an ad hoc evaluation.
For example, it is not possible to detect an undesirable reduction in delivery readiness that accompanies a reduction in stock levels with a “stock”, “stock level” or “stock range” key figure alone. Rather, the aspect of delivery readiness must be included in the analysis as an additional key figure. The supplementary key figures that need to be taken into account when operationalizing a target in order for a target to be fully captured are determined by considering what negative effects an excessive target achievement would have on the overarching purpose of the target or on the targets of other areas of the company:
- Why are we pursuing this goal?
- What is the purpose behind the goal?
- How can I determine that I am not working against the higher purpose of this goal by overachieving it?
For example, it is relatively easy to reduce purchase prices if you are prepared to compromise on product quality or the technical specification of the product. In order to correctly capture the goal of cost reduction, which is usually behind the key figure “purchase price reduction”, other key figures must collect and present the cost-increasing effects that can occur as a result of the price reduction. Possible key figures would be, for example
- Percentage change in quality costs,
- Change in inventory costs due to price reduction measures,
- Change in the total cost of ownership.
These key figures are not easy to understand. This may be one of the reasons why many a reduction in procurement costs later turns out to be an increase in overall costs.
Therefore, let’s keep in mind best practice building block 4: Companies with an effective logistics controlling system take great care to ensure that KPIs fully capture an objective according to its purpose and not according to its wording.
Basic principle 5: Anyone who is measured by a key figure must also have the opportunity to improve it.
It is already so self-evident that we hardly think about it any more: people and departments in our companies are often measured by key figures that they can only influence to a small extent themselves. The fact that someone is responsible for a key figure does not mean that they can influence the value of this key figure themselves.
Typical examples in many companies are the key figure inventory and its variations. Materials management or logistics are usually responsible for inventories. However, an analysis of the inventory drivers in the value chain shows that the level of inventories is decisively influenced by other areas of the company.
No engineer would think of closing a control loop in which the feedback loop runs into nothing. However, logistics controlling without feedback to the originator only works like a “shoot and forget” strategy. For efficient logistics controlling, the corporate functions and divisions that influence the value of a key figure must also be responsible for the level of the key figure, which results in best practice building block 6:
Best-practice logistics controlling brings together causation and responsibility of a key figure. Key figures must be more strongly segmented for this purpose.
Basic principle 6: If you are guided by key figures, you must also understand them.
It sounds kind of funny, but it’s very serious: very few key figures are really understood by the users who are supposed to deal with them and draw conclusions from them, not because users don’t understand the purpose of the key figure, but because many users don’t realize exactly how the numerical value is calculated.
It actually happens to us all the time that we react to key figures without having fully understood them! Just think about the last time you read the newspaper. Every day we are inundated with a multitude of key figures and statistics from which we draw conclusions without knowing how the figures came about in the first place. Winston Churchill is credited with the quote:“I don’t believe any statistics that I haven’t falsified myself“. Unfortunately, this experience does not only apply to reading the newspaper, but also to what happens at work.
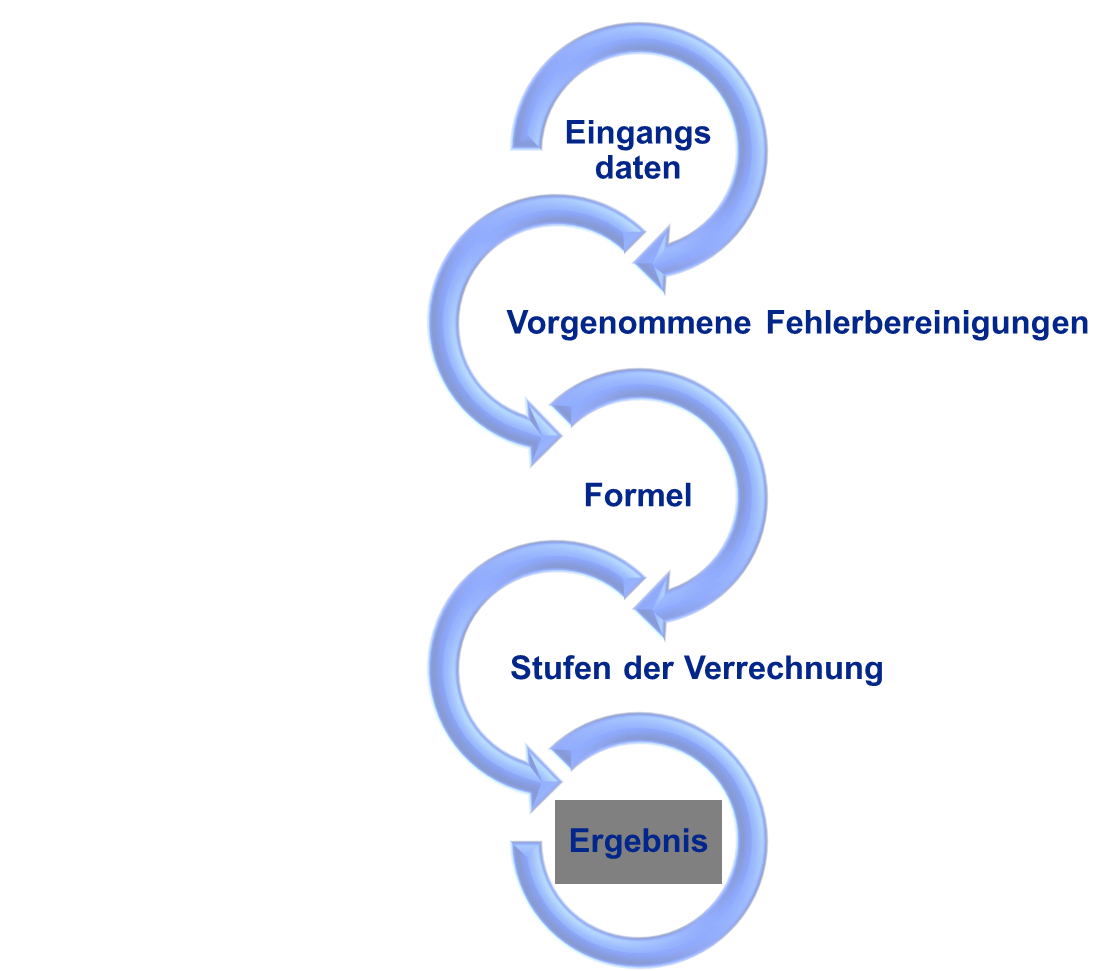
Carry out a self-experiment by writing down three key figures by which you are measured in the company. Now record each key figure,
- exactly how it is defined,
- from which basic figures it is calculated,
- whether and which error corrections have been made to this basic data,
- in which calculation steps the key figure is formed.
Hand on heart, have you succeeded in doing this for all three key figures?
Unfortunately, it is not enough to simply understand the meaning of a key figure. If users have not understood how a key figure is formed, there is a risk that they will draw the wrong conclusions from the change in a key figure value. Want an example?
If you want to determine a stock range of coverage, you can do this in various ways. For example, you relate the current stock to the consumption of the last twelve months and multiply the figure by 365 to obtain the stock range in calendar days. Since your production may only operate on working days, you could also multiply by 260 to express the range in operating calendar days.
Instead of the current stock, you can also view the average stock of the item in the last year. What if, instead of the consumption of the last twelve months, you were to use the forecast for the next twelve months, or just the next three months, or the demand in the planning horizon, or the actual customer orders and demand reservations, or, or, or, or? Do you want to calculate the stock range by value or by quantity? This makes no difference in relation to a single item. If you then add up the stock ranges of the individual items to calculate an average value, it does not matter whether you calculate the stock ranges of the individual items in value or in quantity.
Whether you calculate with quantities or values probably makes a difference if you first add up the stock values and the sales values of the individual items and then form a quotient from the totals. Adding up the quantities of different items and then dividing them by the sum of the unit consumptions may only make sense if the items in question are similar.
What a key figure means, what objective it measures, how it is precisely defined, from which input data it is calculated, which error corrections are made to the basic data, which calculation formula is used and in which stages the key figure is calculated can and must be recorded in a key figure data sheet. This key figure data sheet represents best practice module 6:
A best-practice logistics controlling system contains a detailed key figure data sheet for each logistics key figure.
Such a data sheet not only helps to maintain an overview of the values actually measured and thus the statement of the key figure, it also helps with the transfer of knowledge across departments and with personnel changes. In general, employees play an important role when it comes to the sense and nonsense of key figures! You can find out what these are in the next issue of POTENZIALE…
Further information on this topic can be found here:
Image rights: © Rainer Sturm / aboutpixel.de