
By David Nyeste (Abels & Kemmner GmbH)
In an analysis project at a medical technology manufacturer, the potential for inventory reduction was examined with the help of system support. Due to growth, the Medical Technology division recorded a considerable increase in inventories in previous years. It was therefore reasonable to assume that inventories had risen above the required level and would continue to increase disproportionately to the growth of the division in the future. One of the main restrictions on which the analysis for inventory optimization had to be based was maximum availability. This should ensure that the hard-earned market position is not jeopardized by the risk of an inability to deliver.
Asynchronies in the supply chain
A high degree of uncertainty in the planning quality of customer forecasts and high volatility in historical – particularly short-term – ordering behavior resulted in high inventories of finished goods. In terms of the agreed delivery time, these could have been delivered almost exclusively using the assemble-to-order method. Furthermore, different minimum stock levels at finished product level were contractually agreed with numerous customers. Due to manual planning and inventory control outside of the ERP, there were numerous media discontinuities. Despite the high personnel costs, intransparencies and asynchronies in the supply chain could not be ruled out.
Inventory buffers were also found in production, the original causes of which dated back several years. The concrete causalities for their retention were therefore no longer directly given. Similar inventory buffers, ‘historically grown’ due to delivery failures in the past, were also identified in raw materials purchasing. With delivery times of up to more than six months and high minimum order quantities, the scope for inventory optimization was initially not considered to be significant given the acceptable risk for the supply chain and possible negative effects on production – and therefore on the primary goal of very high delivery capability. These stocks were therefore tolerated or condoned as a ‘necessary evil’.
Potential analysis of inventory reduction
The data analysis showed high data quality in the ERP. Although not all of SAP’s capabilities were utilized, the data was generally up-to-date, complete and reliable. Those sub-processes that were not systemically mapped in SAP were handled by a high level of commitment and organizational skills of the staff outside the ERP using so-called ‘isolated solutions’ such as Excel, paper, e-mail, etc. In addition to increased personnel costs, this resulted in additional sources of error due to system discontinuities and planning specifications based on personal assessment and experience instead of reproducible rules and regulations. This led to asynchronous and incomplete information flows, which are buffered at various points in the supply chain by excessive securities in the inventories.
Article classification
A portfolio analysis and ABC or XYZ classification already revealed at the start of the project that a focus of the inventory values was concentrated on finished products in the ‘assemble-to-order class’. These were stocked with an average range of around five calendar weeks, although they could largely be delivered in line with customer orders in accordance with the general conditions. The item classification also revealed that a significant proportion of the inventory values along the entire supply chain are distributed across components and raw materials that are subject to stockpiling requirements but can be planned very well using statistical forecasts. In the course of the project, simulations were used to quantify the potential for reducing inventory by a total of 20% of the total inventory value, amounting to several million euros.
 Dispositive set of rules
A dispositive set of rules is designed to check and validate identified potentials. This contains all regulations and framework conditions in the form of decision trees, which are used to plan and control material requirements planning at the level of individual material numbers. On the one hand, this makes scheduling specifications more objective, and on the other hand, all influencing variables are parameterized, making results directly comprehensible. Specific examples from the project included the following questions:
- “What contribution, measured as a percentage, does the contractually agreed safety stock make to the required readiness to deliver?”
- “How do different replenishment times affect stocks?”
- “At what point in the value stream of an item is stockpiling mandatory or up to what point should stockpiling be prohibited?”
With the help of the classification and a dispositive set of rules, it was also possible to objectify questions whose answers were previously a matter of discretion for the individual material planner, such as what a day of safety time represents in inventory value, how high the average WIP inventory is per day of lead time and which process-related risks, valued in euros, actually correspond to which inventory values.
Checking the effectiveness of the MRP system using simulation is a kind of litmus test. In this test, the material requirements planning is run against the actual consumption as it occurred in the past using the set rules. The result is a stock flow curve that is derived from the incoming and outgoing goods in accordance with the MRP specifications of the respective set of rules. This inventory curve can be used to measure both the availability achieved and the costs incurred in the form of inventory, ordering and transportation costs, etc.
In addition to target/actual scheduling optimization, this analysis method was also used to analyze and evaluate other scenarios during the course of the project, some of which focused on different production strategies. Due to different production variants, different supply chains and stockpiling strategies could also be mapped, which could be made comparable thanks to quantification using simulation.
Logistical controlling
A decisive means of process control is a control loop that uses defined target values and methods to continuously measure the achievement of the measures applied over a defined period of time. Only by analyzing these measured values is it possible to check effectiveness and efficiency. In turn, these findings can be used to provide evidence of the success of plan targets and to draw conclusions for reviewing and, if necessary, improving measures. The control loop used by Abels & Kemmner during the course of the project included the daily measurement of the delivery readiness achieved at material number level. In contrast to conventional measurement methods, in which delivery readiness is measured solely on the basis of customer order deliveries, this enabled continuous monitoring along the entire value stream.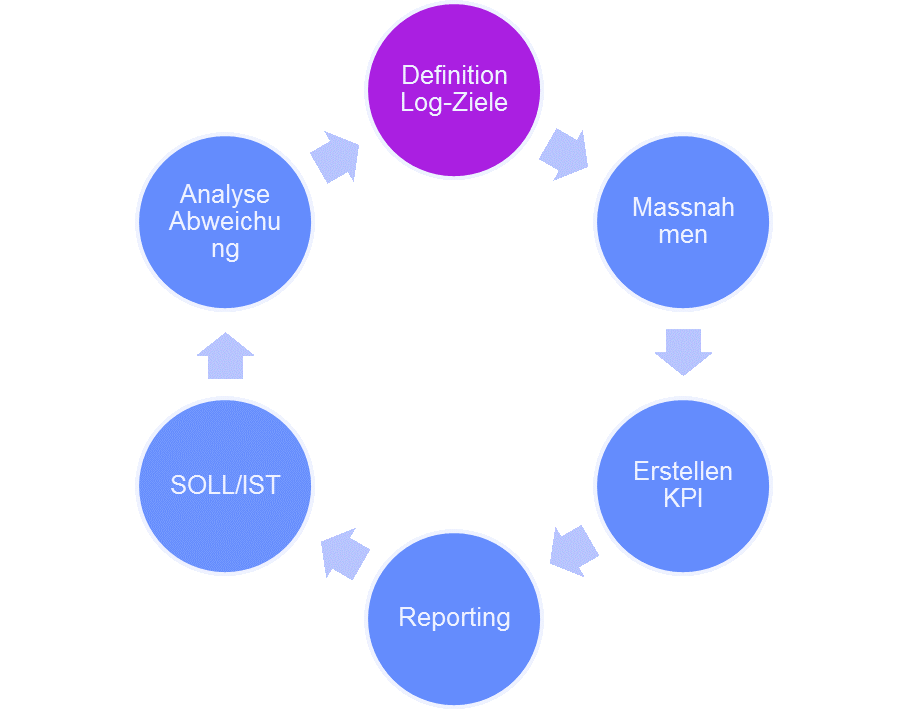
Catalog of measures
The result of the project was a catalog of the most important measures for realizing the potential for reducing inventories. The decisive factor for prioritizing individual measures within this list was the ratio of the absolute success in terms of inventory reduction potential to the associated costs. The most important and at the same time most complex points in this list were the elimination of asynchronies in the supply chain and the objectification of planning and scheduling decisions in materials management on the basis of clearly defined characteristics and key figures.
The comparison may sound trite, but just as the foursome rows fastest when all rowers pull at the same pace, a supply chain is also most effective when it functions without breaks and without frictional losses.
This can be achieved through an optimal balance between automation and flexibility. A high degree of organizational flexibility was ensured by the high level of personal commitment and special communication skills of the employees in the sub-areas. An additional increase in automation and the use of additional systemic support along the entire value chain has not only held out the prospect of an inventory reduction potential of several million euros, but also of additional relief for employees.
Sufficiently complex tasks that require creativity, prudence and flexibility can and should be better performed by humans. This finding was confirmed once again in this analysis project, as the functioning of some sub-processes, such as quality assurance and consignment control, could not be mapped for machine processing. The commitment and expertise of our employees are irreplaceable here.
In contrast, simple, repetitive tasks are predestined for machine processing. Employees with a good knowledge of spreadsheet applications may still be able to calculate a statistical forecast for a suitable material. However, choosing which of the numerous forecasting methods is best suited to a specific case will present even experienced Excel professionals with serious challenges. However, if you add a few more variables to this question (forecast parameters, combinations of forecast and safety stock procedures, etc.), humans and Excel spreadsheets reach their limits.
According to the A & K consultants, the automation mix was not optimally balanced and so the catalog of measures contained almost exclusively recommendations for automation, with the exception of the establishment of logistics controlling.
Further information on this topic can be found here:
- DISKOVER SCO at Serag Wiessner ensures delivery readiness and optimizes production control
- Update of the best practice rules for sales forecasting
- Best practice rules for efficient scheduling