The ABC/XYZ analysis is a portfolio analysis of the product range in which all items in the product portfolio are classified both according to sales (ABC) and according to their regularity of demand (XYZ). The ABC/XYZ analysis provides important insights into the challenges of inventory management and product availability as well as cost optimization and structural optimization in the supply chain and product portfolio.
ABC/XYZ-Analyse: Das kleine Blutbild der Logistik
Anyone who occasionally takes a look at the economic success of their products uses the ABC analysis and anyone who regularly deals with the management of supply chains is also familiar with the XYZ classification. Together, these two considerations result in a small blood picture of logistics, from which key findings can be derived to improve the product portfolio and optimize supply chain management. Surprisingly, the application is far less widespread than one might expect.
Die klassische Struktur der ABC-Analyse
The ABC analysis classifies all finished goods, semi-finished goods, raw materials or merchandise according to their economic importance. The assessment value is typically the turnover and the annual consumption value (stock issue quantity x production costs/unit), occasionally also the annual contribution margin of the last full 12 months. As the contribution margin can also assume negative values, the classification is usually structured somewhat differently here. Sorted by decreasing assessment value, e.g. annual consumption value, the articles that account for the first 80% of total annual consumption across all articles considered are classified as A articles. The next 15% as B articles and the last 5% as C articles. Items with no turnover or annual consumption value in the last 12 months are classified as “N”. In practice, more classes and different class boundaries and class designations are sometimes used.
Die Grenzen der ABC-Analyse
The ABC analysis alone only gives a one-sided picture of the contribution to success of the articles under consideration. An item’s contribution to success also depends on the logistical effort it causes. A key driver of the logistical effort is the regularity with which items are requested from the market. An expensive or inexpensive item that is demanded in small or large quantities, very regularly and in little fluctuating quantities per time unit, e.g. months, causes less logistical effort than an item that is equally expensive and demanded in the same quantity, whose demand quantity fluctuates very strongly and which is demanded sporadically.
The more irregular the demand, the more fluctuating the demand quantity, the higher the safety stock required to ensure the desired delivery capability and the higher the warehousing costs associated with the average stock level, for example. In general, the planning effort for these articles also increases considerably, which causes further costs and reduces the article’s contribution to success.
Das Prinzip der XYZ-Analyse
The XYZ analysis evaluates the aspect of regularity of demand. Items with low fluctuations in demand are classified as X and items with high fluctuations in demand are classified as Z; Y items are in between. In practice, various sizes are used as assessment criteria for classification. We use the coefficient of variation of the fluctuation in demand for each item, combined with the so-called “zero share”. The coefficient of variation is calculated by dividing the standard deviation by the mean value. This makes it possible to compare fluctuations in demand between items with different demand quantities. The zero share records the share of time periods in the total number of periods in which no consumption took place. For example, if an item has not been in demand in 3 of the last 12 months, the zero share is 25%.
In our XYZ classification, items with a zero content of more than 50% are classified as Z2. For items with a zero share of a maximum of 50%, the class separations are at coefficients of variation of 0.5 (X to Y) and 1 (Y to Z). Items that had no consumption in the analysis period are classified as N. In contrast to the ABC analysis, the XYZ analysis does not compare the rankings of articles, but evaluates each article individually.
Die ABC/XYZ-Analyse liefert interessante Erkenntnisse
If each item is rated according to ABC and XYZ and assigned to one of the resulting portfolio fields, interesting characteristics of the item portfolio can be identified.
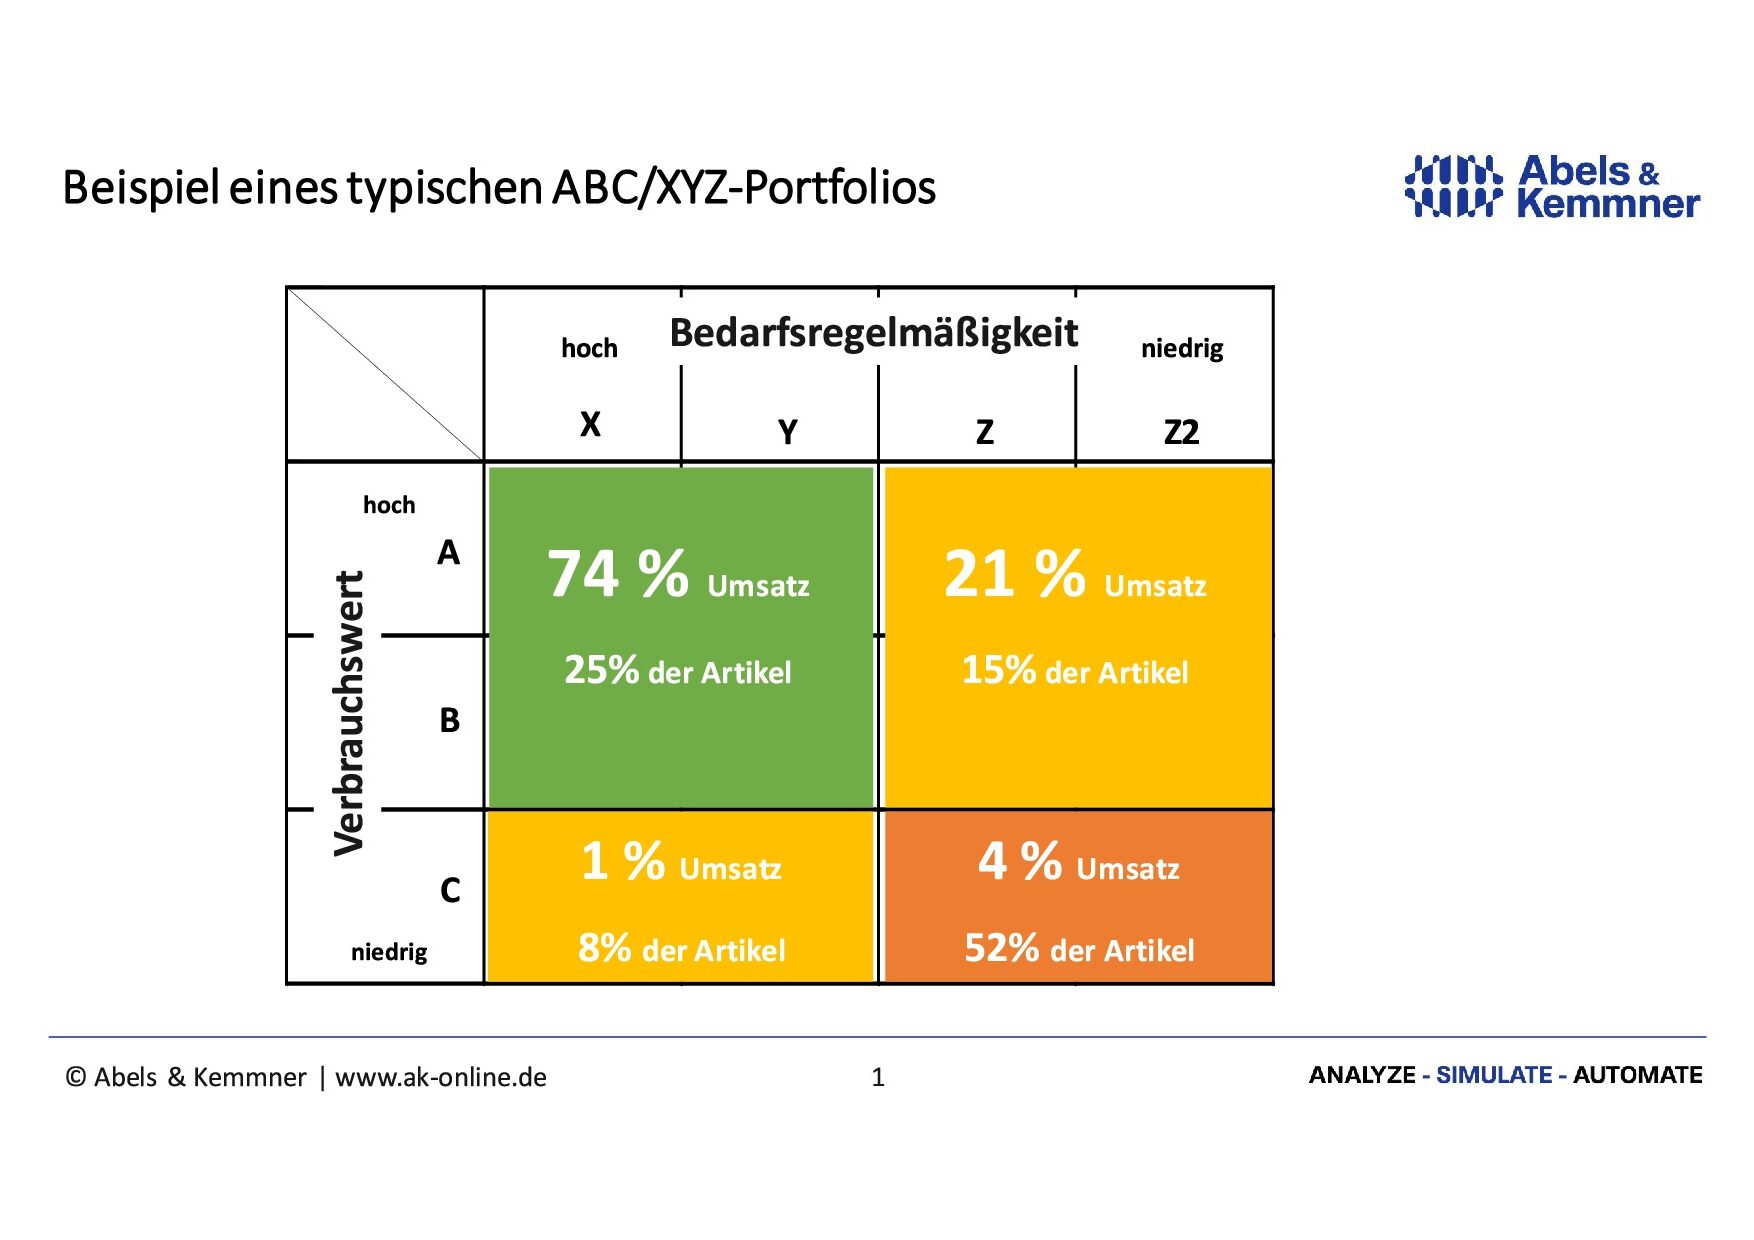
In most cases, the ABXY segment generates 60% to 80% of sales (or the annual consumption value) with 20% to 40% of the material numbers. At the other end of the portfolio, in the CZZ2 segment, 2% to 4% of sales are achieved with 40% to 60% of material numbers. In the CZZ2 segment, far higher inventory ranges are also required to achieve the same delivery readiness as in the ABXY segment.
Unser Tipp: Bei Fertigwaren wird im CZ2-Segment wird kein Geld verdient
Since at least part of the costs of a contribution margin calculation are determined according to carrying capacity and not according to cost causation, the contribution margins in the CZZ2 segment of finished goods often give a false picture of the profitability of this product portfolio. In random process cost analyses, we have repeatedly found that no positive contribution margins are generated, at least in the CZ2 segment and also by many articles in the CZ segment. Product range constraints may mean that items have to be offered in this segment. In this case, however, the principle of “no AX, no CZ” must be consistently applied. Customers who switch to the competition with their ABXY articles must no longer be able to order CCZ2 articles.
In addition, you should reduce the delivery readiness in the CZZ2 segment of a finished goods portfolio or switch to minimum stock planning and use suitable tools to ensure that the CZZ2 portfolio can be planned as automatically as possible.
Weitere Vorteile
Experts gain numerous other tips from the ABC/XYZ portfolio, e.g. with regard to Kanban suitability, the ability to automate planning and scheduling and incorrectly set logistical decoupling points.
However, it would be going too far to discuss this at this point.